While forces like interest rates, demographics, and the economy help drive the housing market as a whole, the strength of your local market depends on other factors closer to home. When you zoom out to look at U.S. real estate from a bird’s eye view, you’ll see this regional variance in full effect. Some markets are booming while others are tanking, and the contrast between the winners and losers is a stark one.
Real Estate Booms
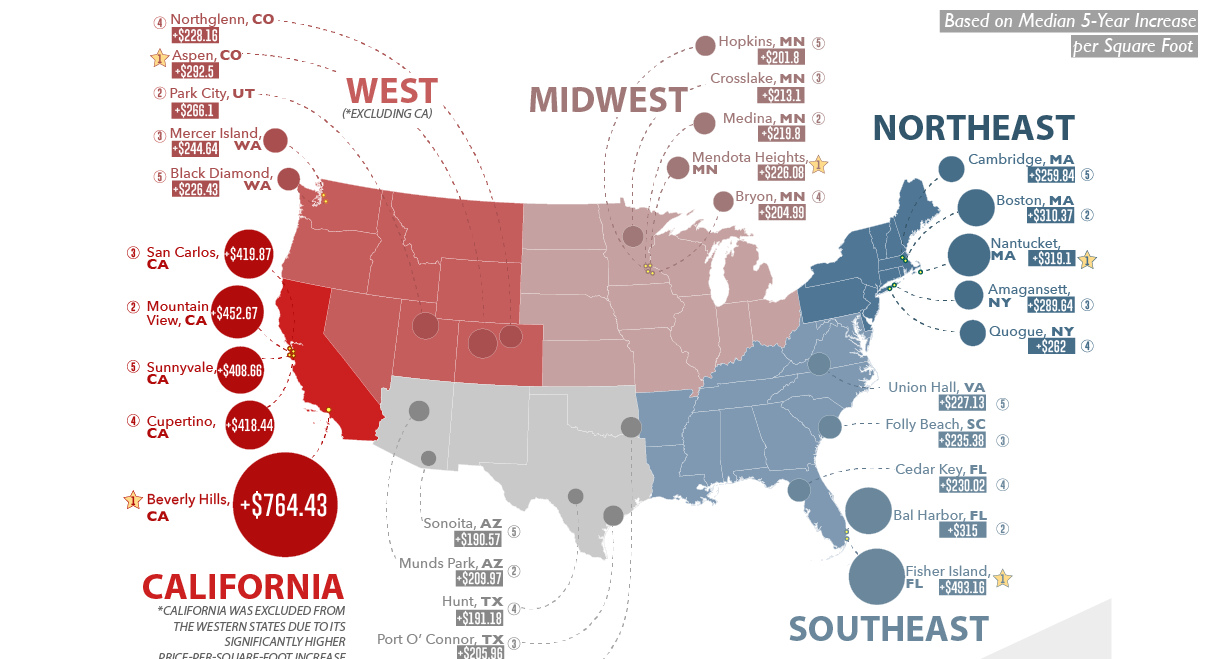
Today’s infographic comes from TitleMax, and it shows where real estate prices are appreciating and depreciating the fastest. We’ll start on the high end: here are the 10 cities that have seen the highest absolute growth in terms of price per square foot over the last five years.
The only non-California locale to make it onto the list is Fisher Island in Miami, Florida, which is home to just 467 residents including Andre Agassi, Oprah Winfrey, and Robert Herjavec. While these are absolute increases, it’s worth noting that they are still very significant in relative terms. For example, although it’s true that Beverley Hills is the most expensive housing market in the U.S., prices have risen 47% over the last five years.
Real Estate Busts
Things may be rosy in the Golden State, but there are also places spread throughout the country where prices are dropping fast. Many of these are smaller, lesser-known locales – and while they are located all over the map, eight of them are in states along the Eastern Seaboard.
A Stark Contrast
If you sold a 1,000 sq. ft condo in Beverley Hills – the country’s most expensive real estate market – it would likely net you about $1.6 million. What could you buy for that in Tamaqua, PA, the country’s cheapest? In theory, you could pick up roughly 71,000 sq. ft of real estate – that’s about 10 mansions worth, or just short of the size of an average Walmart. on These are in the form of Treasury securities, some of the most liquid assets worldwide. Central banks use them for foreign exchange reserves and private investors flock to them during flights to safety thanks to their perceived low default risk. Beyond these reasons, foreign investors may buy Treasuries as a store of value. They are often used as collateral during certain international trade transactions, or countries can use them to help manage exchange rate policy. For example, countries may buy Treasuries to protect their currency’s exchange rate from speculation. In the above graphic, we show the foreign holders of the U.S. national debt using data from the U.S. Department of the Treasury.
Top Foreign Holders of U.S. Debt
With $1.1 trillion in Treasury holdings, Japan is the largest foreign holder of U.S. debt. Japan surpassed China as the top holder in 2019 as China shed over $250 billion, or 30% of its holdings in four years. This bond offloading by China is the one way the country can manage the yuan’s exchange rate. This is because if it sells dollars, it can buy the yuan when the currency falls. At the same time, China doesn’t solely use the dollar to manage its currency—it now uses a basket of currencies. Here are the countries that hold the most U.S. debt: As the above table shows, the United Kingdom is the third highest holder, at over $655 billion in Treasuries. Across Europe, 13 countries are notable holders of these securities, the highest in any region, followed by Asia-Pacific at 11 different holders. A handful of small nations own a surprising amount of U.S. debt. With a population of 70,000, the Cayman Islands own a towering amount of Treasury bonds to the tune of $284 billion. There are more hedge funds domiciled in the Cayman Islands per capita than any other nation worldwide. In fact, the four smallest nations in the visualization above—Cayman Islands, Bermuda, Bahamas, and Luxembourg—have a combined population of just 1.2 million people, but own a staggering $741 billion in Treasuries.
Interest Rates and Treasury Market Dynamics
Over 2022, foreign demand for Treasuries sank 6% as higher interest rates and a strong U.S. dollar made owning these bonds less profitable. This is because rising interest rates on U.S. debt makes the present value of their future income payments lower. Meanwhile, their prices also fall. As the chart below shows, this drop in demand is a sharp reversal from 2018-2020, when demand jumped as interest rates hovered at historic lows. A similar trend took place in the decade after the 2008-09 financial crisis when U.S. debt holdings effectively tripled from $2 to $6 trillion.
Driving this trend was China’s rapid purchase of Treasuries, which ballooned from $100 billion in 2002 to a peak of $1.3 trillion in 2013. As the country’s exports and output expanded, it sold yuan and bought dollars to help alleviate exchange rate pressure on its currency. Fast-forward to today, and global interest-rate uncertainty—which in turn can impact national currency valuations and therefore demand for Treasuries—continues to be a factor impacting the future direction of foreign U.S. debt holdings.