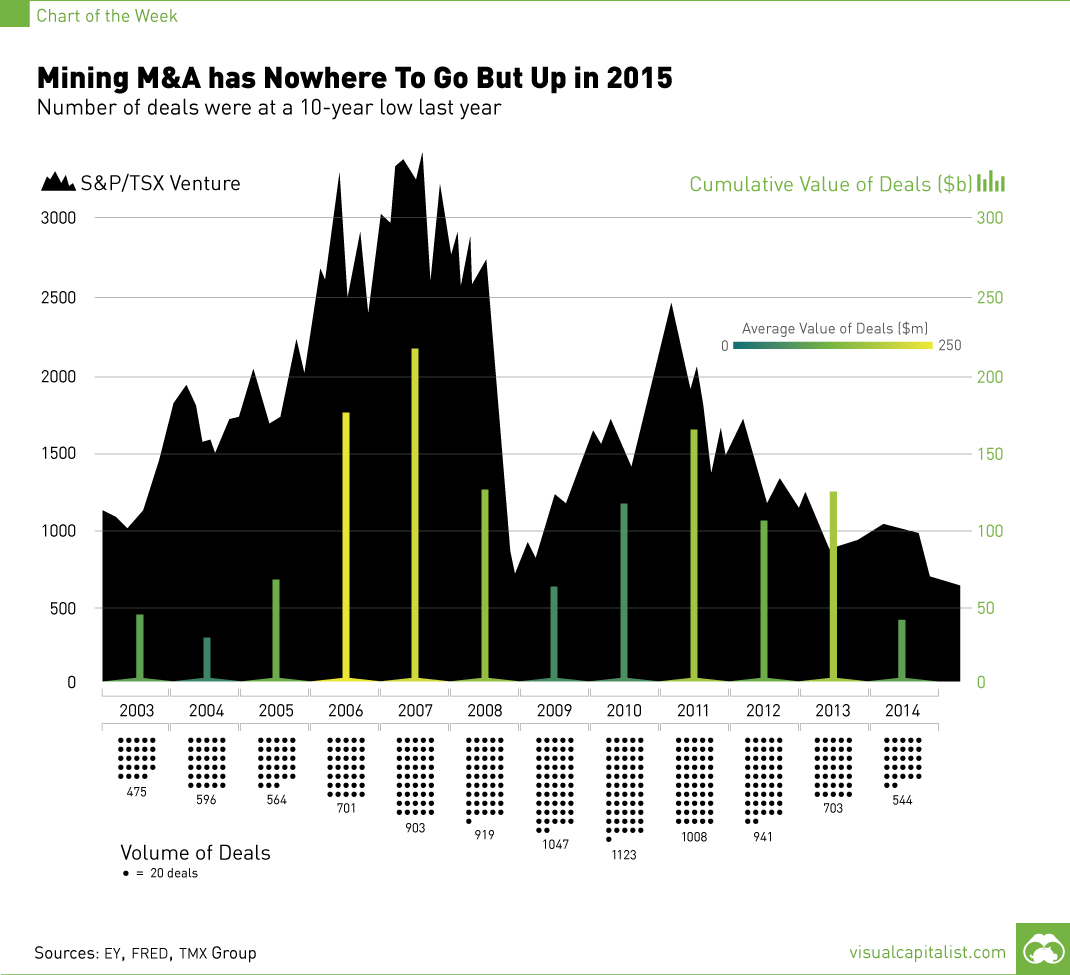
Mining M&A Has Nowhere To Go But Up In 2015 [Chart]
The Chart of the Week is a weekly Visual Capitalist feature on Fridays. This week, Alamos Gold and AuRico announced a merger worth $1.5 billion. This is all while broad speculation continues that former Xstrata boss Mick Davis is looking to finally deploy his $5.6 billion war chest held by his company, X2 Resources. Common wisdom is that the majority of mergers and acquisitions (M&A) such as these take place at both the peaks and the troughs of the market. In this week’s Chart of the Week, we wanted to take a look at the truth of this statement over the last dozen years. The answer: the number of deals peaked in the aftermath of the Financial Crisis in 2009 and 2010. During this time, the overall market dropped off and subsequently recovered with the commodity supercycle still intact. The average value per deal was very low post-crisis, steadily increasing until 2011 when the junior market would reach its most recent heights. During hot market years, M&A activity was frequent and significant. In years such as 2006, 2007, and 2011, both the cumulative value and the average value per deal were at their highest rates. In the down year of 2013 the data was also relatively positive, but it was also skewed by the $90 billion merger of Glencore and Xstrata. Not including this outlier, it would appear that the data point would be more inline with the trend. Last year, there were 544 deals for the unimpressive total of $44.6 billion. The volume of deals and their cumulative value reached their lowest points since 2003 and 2004 respectively. Most deals in 2015 will follow suit from the previous year, serving defensive and conservative means such as the Alamos and AuRico merger. However, if Mr. Davis or like-minded groups start dipping into their war chests, that will mark the beginning of something new: the tilting to the speculative side of M&A that traditionally is a prelude to market recovery.
on Today’s chart measures the extent to which 41 major economies are reopening, by plotting two metrics for each country: the mobility rate and the COVID-19 recovery rate: Data for the first measure comes from Google’s COVID-19 Community Mobility Reports, which relies on aggregated, anonymous location history data from individuals. Note that China does not show up in the graphic as the government bans Google services. COVID-19 recovery rates rely on values from CoronaTracker, using aggregated information from multiple global and governmental databases such as WHO and CDC.
Reopening Economies, One Step at a Time
In general, the higher the mobility rate, the more economic activity this signifies. In most cases, mobility rate also correlates with a higher rate of recovered people in the population. Here’s how these countries fare based on the above metrics. Mobility data as of May 21, 2020 (Latest available). COVID-19 case data as of May 29, 2020. In the main scatterplot visualization, we’ve taken things a step further, assigning these countries into four distinct quadrants:
1. High Mobility, High Recovery
High recovery rates are resulting in lifted restrictions for countries in this quadrant, and people are steadily returning to work. New Zealand has earned praise for its early and effective pandemic response, allowing it to curtail the total number of cases. This has resulted in a 98% recovery rate, the highest of all countries. After almost 50 days of lockdown, the government is recommending a flexible four-day work week to boost the economy back up.
2. High Mobility, Low Recovery
Despite low COVID-19 related recoveries, mobility rates of countries in this quadrant remain higher than average. Some countries have loosened lockdown measures, while others did not have strict measures in place to begin with. Brazil is an interesting case study to consider here. After deferring lockdown decisions to state and local levels, the country is now averaging the highest number of daily cases out of any country. On May 28th, for example, the country had 24,151 new cases and 1,067 new deaths.
3. Low Mobility, High Recovery
Countries in this quadrant are playing it safe, and holding off on reopening their economies until the population has fully recovered. Italy, the once-epicenter for the crisis in Europe is understandably wary of cases rising back up to critical levels. As a result, it has opted to keep its activity to a minimum to try and boost the 65% recovery rate, even as it slowly emerges from over 10 weeks of lockdown.
4. Low Mobility, Low Recovery
Last but not least, people in these countries are cautiously remaining indoors as their governments continue to work on crisis response. With a low 0.05% recovery rate, the United Kingdom has no immediate plans to reopen. A two-week lag time in reporting discharged patients from NHS services may also be contributing to this low number. Although new cases are leveling off, the country has the highest coronavirus-caused death toll across Europe. The U.S. also sits in this quadrant with over 1.7 million cases and counting. Recently, some states have opted to ease restrictions on social and business activity, which could potentially result in case numbers climbing back up. Over in Sweden, a controversial herd immunity strategy meant that the country continued business as usual amid the rest of Europe’s heightened regulations. Sweden’s COVID-19 recovery rate sits at only 13.9%, and the country’s -93% mobility rate implies that people have been taking their own precautions.
COVID-19’s Impact on the Future
It’s important to note that a “second wave” of new cases could upend plans to reopen economies. As countries reckon with these competing risks of health and economic activity, there is no clear answer around the right path to take. COVID-19 is a catalyst for an entirely different future, but interestingly, it’s one that has been in the works for a while. —Carmen Reinhart, incoming Chief Economist for the World Bank Will there be any chance of returning to “normal” as we know it?