The ranking uses annual data from the U.S. Department of State’s Bureau of Consular Affairs to visualize the countries whose citizens are receiving the highest number of U.S. immigrant visas.
U.S. Immigration Processes
The process of U.S. immigration is confusing at best, but it always starts with a visa. A visa, in the context of immigration, is essentially a permit to enter the country, issued to those looking to work and live in the United States. There are two visa categories: immigrant and non-immigrant.
Non-immigrant visas
These visas are typically for temporary workers, but also serve other purposes, like basic travel for tourists from certain countries. Even when obtained for work purposes however, non-immigrant visas expire and do not lead to green cards or citizenship. Some examples of non-immigrant visas categories include: members of the press, diplomatic representatives, foreign military personnel stationed in the U.S., athletes, and a plethora of other unique situations. The popular, and nearly unattainable, H-1B visas are actually non-immigrant visas.
Immigrant visas
Immigrant visas, on the other hand, can either be employment-based or family-based. The intention behind them is that they will eventually lead to permanent status in the U.S., either through green cards or citizenship. A common example of an immigration visa is the K-1 visa or the “fiancé visa” for individuals marrying American citizens.
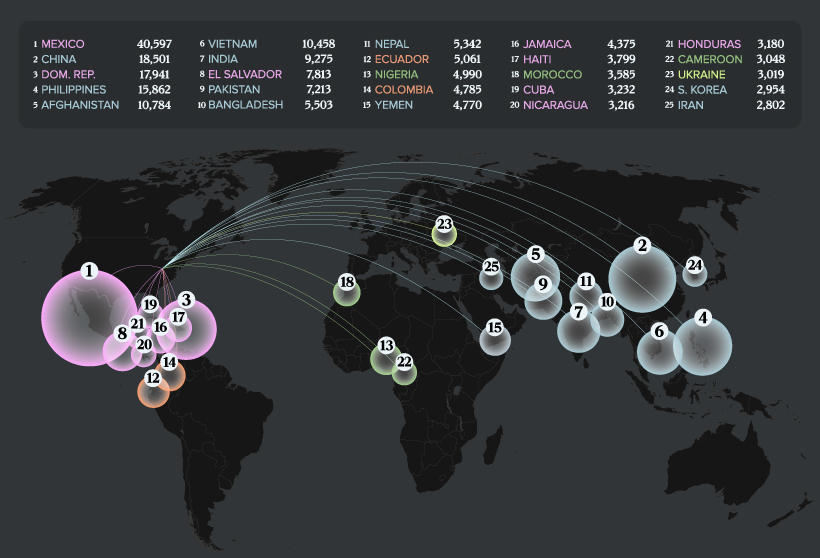
Who’s Getting U.S. Immigrant Visas?
Last year, more than 285,000 U.S. immigrant visas were issued. Here’s a look how that is distributed across every country worldwide: Mexican citizens received the highest number of visas to immigrate permanently to the U.S. at nearly 40,600. America’s other neighbor, Canada, ranked 43rd, only receiving 1,464 visas. China and India also rank high on the list, ranking at #2 and #7 respectively. Interestingly, only one European country, Ukraine, made the top 25. In 2021, prior to the Russian invasion, Ukrainians obtained 3,019 visas. A number of the top visa recipient nations are marked by violence and political unrest, like Afghanistan (#5) and Iran (#25). Looking beyond the top 25, one surprising find is that eight North Korean citizens received immigration visas last year. Additionally, a number of countries only received a handful of U.S. immigrant visas including Luxembourg’s two, and Timor-Leste’s one. Regionally, the bulk of the highest ranking countries are located in Asia. Here’s a breakdown: Finally, here’s the geographical distribution of persons receiving U.S. immigrant visas.
The State of U.S. Immigration
Around 15% of the U.S. population is made up of immigrants, and the country is home to the highest number of total immigrants in the world, at 50.6 million. In terms of how many visas are issued annually, there is a federal ceiling of 700,000 and certain countries have their own specific caps on how many their citizens can receive, as mandated by the United States. Although the numbers change drastically year by year, they have not come close to the limit in the last decade. Here’s a look at the total U.S. immigrant visa issuances globally. Notably, they diminished by almost half during the pandemic: Overall, whether for economic purposes, reunification of families, or in fleeing from danger, people are continuing to come to the United States. In the period between 2016 and 2060, it’s expected that the share of the U.S. population that is American-born is going to grow by 20%. Meanwhile, the share of the population that is foreign-born is expected to jump by 58%. on Last year, stock and bond returns tumbled after the Federal Reserve hiked interest rates at the fastest speed in 40 years. It was the first time in decades that both asset classes posted negative annual investment returns in tandem. Over four decades, this has happened 2.4% of the time across any 12-month rolling period. To look at how various stock and bond asset allocations have performed over history—and their broader correlations—the above graphic charts their best, worst, and average returns, using data from Vanguard.
How Has Asset Allocation Impacted Returns?
Based on data between 1926 and 2019, the table below looks at the spectrum of market returns of different asset allocations:
We can see that a portfolio made entirely of stocks returned 10.3% on average, the highest across all asset allocations. Of course, this came with wider return variance, hitting an annual low of -43% and a high of 54%.
A traditional 60/40 portfolio—which has lost its luster in recent years as low interest rates have led to lower bond returns—saw an average historical return of 8.8%. As interest rates have climbed in recent years, this may widen its appeal once again as bond returns may rise.
Meanwhile, a 100% bond portfolio averaged 5.3% in annual returns over the period. Bonds typically serve as a hedge against portfolio losses thanks to their typically negative historical correlation to stocks.
A Closer Look at Historical Correlations
To understand how 2022 was an outlier in terms of asset correlations we can look at the graphic below:
The last time stocks and bonds moved together in a negative direction was in 1969. At the time, inflation was accelerating and the Fed was hiking interest rates to cool rising costs. In fact, historically, when inflation surges, stocks and bonds have often moved in similar directions. Underscoring this divergence is real interest rate volatility. When real interest rates are a driving force in the market, as we have seen in the last year, it hurts both stock and bond returns. This is because higher interest rates can reduce the future cash flows of these investments. Adding another layer is the level of risk appetite among investors. When the economic outlook is uncertain and interest rate volatility is high, investors are more likely to take risk off their portfolios and demand higher returns for taking on higher risk. This can push down equity and bond prices. On the other hand, if the economic outlook is positive, investors may be willing to take on more risk, in turn potentially boosting equity prices.
Current Investment Returns in Context
Today, financial markets are seeing sharp swings as the ripple effects of higher interest rates are sinking in. For investors, historical data provides insight on long-term asset allocation trends. Over the last century, cycles of high interest rates have come and gone. Both equity and bond investment returns have been resilient for investors who stay the course.