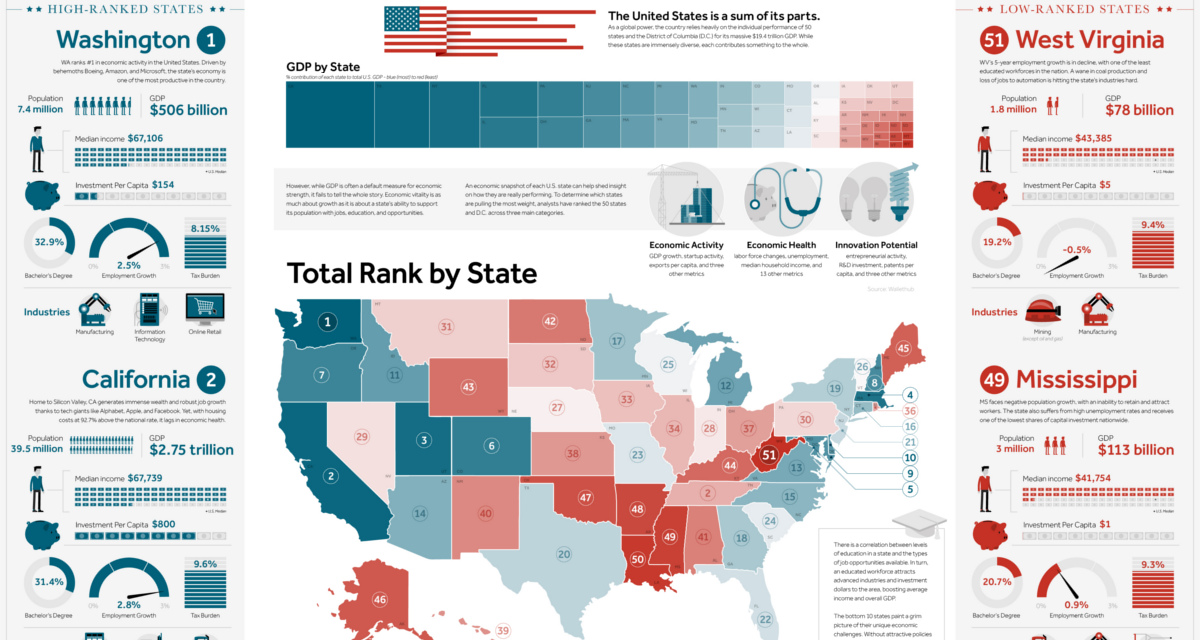
On a global scale, the U.S. economy is massive at close to $19 trillion in size. However, the United States is also the sum of its parts. America represents the union of 50 states and other jurisdictions such as D.C., and all of these state-level economies have their own unique problems to overcome, drivers of growth, and local resources that factor into their prosperity. How can we compare these state economies on an even playing field?
Ranked: State Economies
Using absolute numbers, it’s hard to directly compare California ($2.75 trillion GDP, 39.5 million people) to a state like Vermont ($33 billion, 0.6 million people). By leveling the playing field, we can get an idea of how states contrast in terms of relative economic strength that companies and workers would better recognize. Today’s infographic uses 27 metrics from WalletHub to rank state economies. These metrics are grouped into three major categories, which are evenly weighted:
- Economic Activity: GDP growth, startup activity, exports per capita, and three other metrics 2. Economic Health: Labor force changes, median household income, unemployment, and 13 other metrics 3. Innovation Potential: Entrepreneurial activity, R&D investment, patents per capita, and three other metrics Note: the full methodology with all 27 factors can be found here. Here’s how the rankings shake down, for all 50 state economies and D.C.: Topping the list for overall score were the states of Washington, California, and Utah, and the first place state in each major category includes Washington (Economic Activity), Utah (Economic Health), and Massachusetts (Innovation Potential).
Case in Point
Looking at statistics and scoring methodologies alone can be a bit esoteric, so let’s look at some individual cases to see some contrast. Utah (Rank: #3) Utah consistently ranks as one of the top states for business, in the country, as well as a top state for job growth and employment. It’s also pretty unique in that it has a fairly diversified economy, with major sectors in the tourism, agriculture, tech, manufacturing, finance, energy, and mining industries. Utah has a higher median household income ($65,977), and a blistering 3.4% employment growth rate. Florida (Rank: #22) Using this methodology, Florida falls somewhere in the middle of the rankings. The good news is the state has good employment growth (2.9%) and a myriad of thriving industries like aerospace. The bad news? Florida has the second-highest level of poverty in the union at 19%, and it also has a lower median household income ($50,860) than the national average. Maine (Rank: #45) Economic activity is sluggish in the country’s most northeastern state. With an aging population, slow employment growth (0.8%), and a number of lost manufacturing jobs over the last 15 years, the state is trying to rebound. Maine isn’t helped by having one of the highest tax burdens for its citizens and businesses in the country, either. on Both figures surpassed analyst expectations by a wide margin, and in January, the unemployment rate hit a 53-year low of 3.4%. With the recent release of February’s numbers, unemployment is now reported at a slightly higher 3.6%. A low unemployment rate is a classic sign of a strong economy. However, as this visualization shows, unemployment often reaches a cyclical low point right before a recession materializes.
Reasons for the Trend
In an interview regarding the January jobs data, U.S. Treasury Secretary Janet Yellen made a bold statement: While there’s nothing wrong with this assessment, the trend we’ve highlighted suggests that Yellen may need to backtrack in the near future. So why do recessions tend to begin after unemployment bottoms out?
The Economic Cycle
The economic cycle refers to the economy’s natural tendency to fluctuate between periods of growth and recession. This can be thought of similarly to the four seasons in a year. An economy expands (spring), reaches a peak (summer), begins to contract (fall), then hits a trough (winter). With this in mind, it’s reasonable to assume that a cyclical low in the unemployment rate (peak employment) is simply a sign that the economy has reached a high point.
Monetary Policy
During periods of low unemployment, employers may have a harder time finding workers. This forces them to offer higher wages, which can contribute to inflation. For context, consider the labor shortage that emerged following the COVID-19 pandemic. We can see that U.S. wage growth (represented by a three-month moving average) has climbed substantially, and has held above 6% since March 2022. The Federal Reserve, whose mandate is to ensure price stability, will take measures to prevent inflation from climbing too far. In practice, this involves raising interest rates, which makes borrowing more expensive and dampens economic activity. Companies are less likely to expand, reducing investment and cutting jobs. Consumers, on the other hand, reduce the amount of large purchases they make. Because of these reactions, some believe that aggressive rate hikes by the Fed can either cause a recession, or make them worse. This is supported by recent research, which found that since 1950, central banks have been unable to slow inflation without a recession occurring shortly after.
Politicians Clash With Economists
The Fed has raised interest rates at an unprecedented pace since March 2022 to combat high inflation. More recently, Fed Chairman Jerome Powell warned that interest rates could be raised even higher than originally expected if inflation continues above target. Senator Elizabeth Warren expressed concern that this would cost Americans their jobs, and ultimately, cause a recession. Powell remains committed to bringing down inflation, but with the recent failures of Silicon Valley Bank and Signature Bank, some analysts believe there could be a pause coming in interest rate hikes. Editor’s note: just after publication of this article, it was confirmed that U.S. interest rates were hiked by 25 basis points (bps) by the Federal Reserve.