Since the COVID-19 crash, global equity markets have seen a strong recovery. The 100 biggest companies in the world were worth a record-breaking $31.7 trillion as of March 31 2021, up 48% year-over-year. As a point of comparison, the combined GDP of the U.S. and China was $35.7 trillion in 2020. In today’s graphic, we use PwC data to show the world’s biggest businesses by market capitalization, as well as the countries and sectors they are from.
The Top 100, Ranked
PwC ranked the largest publicly-traded companies by their market capitalization in U.S. dollars. It’s also worth noting that sector classification is based on the FTSE Russell Industry Classification Benchmark, and a company’s location is based on where its headquarters are located. Here is the top 100 ranking of the biggest companies in the world, organized from the biggest to the smallest. Note: Data as of March 31, 2021.
Within the ranking, there was a wide disparity in value. Apple was worth over $2 trillion, more than 16 times that of Anheuser-Busch (AB InBev), which took the 100th spot at $128 billion. In total, 59 companies were headquartered in the United States, making up 65% of the top 100’s total market capitalization. China and its regions was the second most common location for company headquarters, with 14 companies on the list.
Risers and Fallers
What are some of the notable changes to the biggest companies in the world compared to last year’s ranking? Tesla’s market capitalization surged by an eye-watering 565%, temporarily making Elon Musk the richest person in the world. Food delivery platform Meituan and PayPal benefited from growing e-commerce popularity with their market capitalizations growing by 221% and 151% respectively. Tech companies TSMC and ASML Holdings were also among the top 10 risers, thanks to a shortage of semiconductor chips and growing demand. On the other end of the scale, Swiss companies Nestlé, Novartis, and Roche Holding were all among the bottom 10 companies by market capitalization growth. China Mobile was the only company to decline with a -12% change. The company was delisted from the New York Stock Exchange as a result of an executive order issued by former president Donald Trump, and recently announced its intention to list on the Shanghai Stock Exchange.
A Sector View
Across the 100 biggest companies in the world, some sectors had higher weightings. Technology had the highest market capitalization and was also the most common sector, with Big Tech dominating the top 10. Companies in the consumer discretionary, financials, and health care sectors also had a strong representation in the ranking. Despite having only five companies on the list, the energy sector amounted to almost 10% of the top 100’s market capitalization, mostly due to Saudi Aramco’s whopping valuation.
An Uncertain Recovery
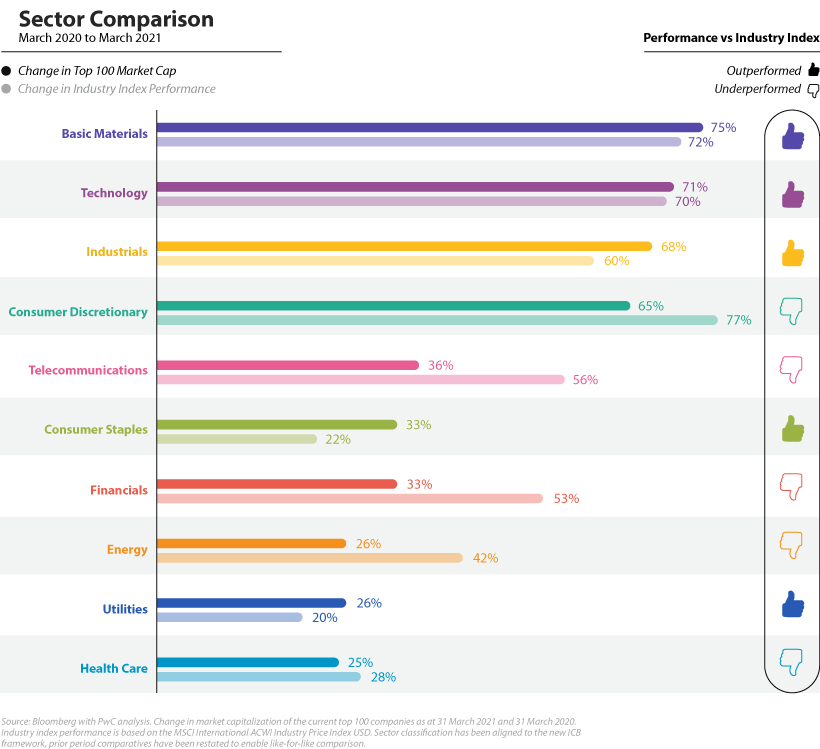
From near market lows on March 31, 2020, all sectors saw increases in their market capitalization. However, top 100 companies in some sectors outperformed their respective industry index, while others did not.
Basic materials and industrials, both cyclical sectors, were high performers in the top 100 and outperformed their respective industry indexes. Technology companies also outperformed, and accounted for $255 billion or 31% of all shareholder distributions by the top 100, far more than any other sector. Apple alone spent $73 billion on share buybacks and $14 billion in dividends in the 2020 calendar year. On the other hand, the worst-performing sectors in the top 100 were health care, utilities, and energy. While the index performance for health care and utilities was also relatively poor, the wider energy sector performed fairly well. It’s perhaps not surprising that all sectors saw positive returns since their low levels in March 2020, buoyed by fiscal stimulus and central bank policies. As countries begin to reopen, will the value of the biggest companies in the world continue to climb? on Last year, stock and bond returns tumbled after the Federal Reserve hiked interest rates at the fastest speed in 40 years. It was the first time in decades that both asset classes posted negative annual investment returns in tandem. Over four decades, this has happened 2.4% of the time across any 12-month rolling period. To look at how various stock and bond asset allocations have performed over history—and their broader correlations—the above graphic charts their best, worst, and average returns, using data from Vanguard.
How Has Asset Allocation Impacted Returns?
Based on data between 1926 and 2019, the table below looks at the spectrum of market returns of different asset allocations:
We can see that a portfolio made entirely of stocks returned 10.3% on average, the highest across all asset allocations. Of course, this came with wider return variance, hitting an annual low of -43% and a high of 54%.
A traditional 60/40 portfolio—which has lost its luster in recent years as low interest rates have led to lower bond returns—saw an average historical return of 8.8%. As interest rates have climbed in recent years, this may widen its appeal once again as bond returns may rise.
Meanwhile, a 100% bond portfolio averaged 5.3% in annual returns over the period. Bonds typically serve as a hedge against portfolio losses thanks to their typically negative historical correlation to stocks.
A Closer Look at Historical Correlations
To understand how 2022 was an outlier in terms of asset correlations we can look at the graphic below:
The last time stocks and bonds moved together in a negative direction was in 1969. At the time, inflation was accelerating and the Fed was hiking interest rates to cool rising costs. In fact, historically, when inflation surges, stocks and bonds have often moved in similar directions. Underscoring this divergence is real interest rate volatility. When real interest rates are a driving force in the market, as we have seen in the last year, it hurts both stock and bond returns. This is because higher interest rates can reduce the future cash flows of these investments. Adding another layer is the level of risk appetite among investors. When the economic outlook is uncertain and interest rate volatility is high, investors are more likely to take risk off their portfolios and demand higher returns for taking on higher risk. This can push down equity and bond prices. On the other hand, if the economic outlook is positive, investors may be willing to take on more risk, in turn potentially boosting equity prices.
Current Investment Returns in Context
Today, financial markets are seeing sharp swings as the ripple effects of higher interest rates are sinking in. For investors, historical data provides insight on long-term asset allocation trends. Over the last century, cycles of high interest rates have come and gone. Both equity and bond investment returns have been resilient for investors who stay the course.