Today’s graphic pulls data from the 2020 edition of Brand Finance’s annual Global 500 report, which ranks the world’s top brands by value using a multi-dimensional formula. By quantifying the true value of a brand, investors and key decision makers can identify value that extends beyond quarterly earnings reports. How much are brands really worth?
A Closer Look at the Leaderboard
Although tech companies command five of the top 10 spots in the ranking, brands from more traditional industries are hot on their tails. Here are the top 100 most valuable brands according to the report: American retail giant Walmart enters 2020’s top 10 ranking with an impressive brand value increase of 14% to $77.5 billion. The retailer’s recent success could be partially attributed to its growing strategic partnership with Microsoft—which currently sits in sixth place. By tapping into Microsoft’s cloud services, Walmart can now provide a digital first retail experience for its customers. Another brand that has experienced remarkable growth is China’s leading insurance company, Ping An. With 19.8% growth, resulting in a brand value of $69 billion, the financial conglomerate’s aggressive focus on fintech R&D has garnered the company 200 million retail customers and 500 million internet users—making it one of the largest financial services companies in the world. While the majority of the world’s most valuable brands hail from the U.S. or China, which brands lead by region?
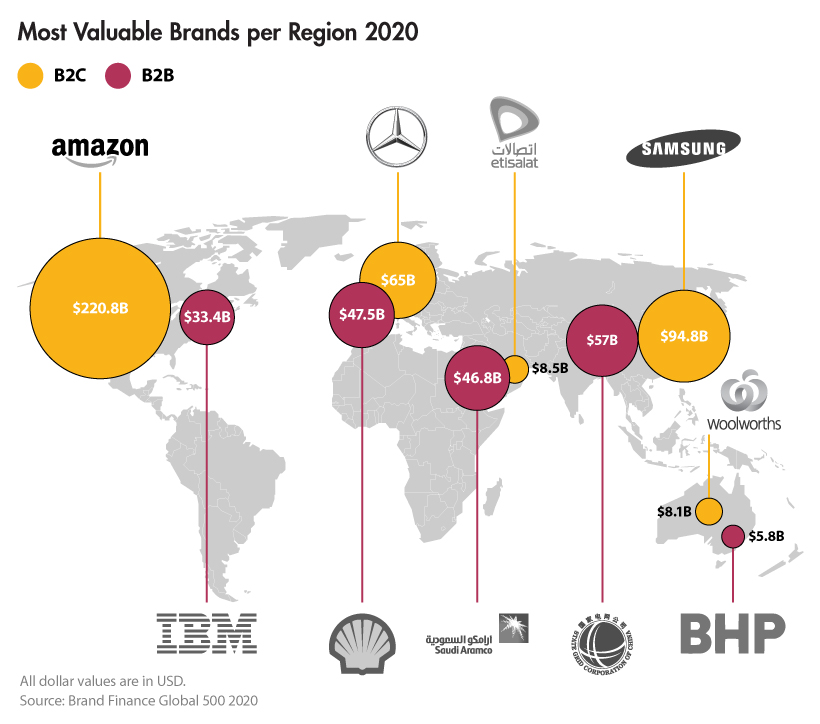
Most Valuable Brands by Region
In Europe, German companies outperformed other countries, with automotive brand Mercedes-Benz holding the title for the most valuable B2C brand for that continent—despite China being its biggest market. On the other side of the world, Samsung reigns as Asia’s most valuable B2C brand. The company owns 54% of the nascent 5G market globally, having shipped 6.7 million 5G phones in the last year alone.
A Brand Eat Brand World
Whether brands are regional or global leaders, they still face the threat of being knocked of their perch by brands experiencing significant growth.
Climbing to the Top
With an increase of 65% to $12.4 billion, Tesla is officially the fastest-growing brand in the world. Despite concerns over not being able to keep up with demand, the electric car company is expected to exceed 500,000 vehicle deliveries in 2020. Having recently posted over $7 billion of revenue in the fourth quarter of 2019, the success of Tesla’s innovative models is sure to rattle the automotive brands in the ranking. However, not everything comes down to innovation. European retailers Lidl and Aldi have seen growth of 40% and 37% respectively, and are only getting started. After disrupting Europe’s entire supermarket industry by offering quality products at significantly lower prices, the chains now have their sights set on the U.S. market, with Aldi expected to surpass Kroger in sales. —David Haigh, CEO Brand Finance In contrast, there are also well established brands that have struggled to retain brand value.
Racing to the Bottom
Chinese search engine Baidu—also known as the Google of China—recorded the largest drop in brand value, decreasing by 54% to $8.9 billion. The brand has struggled with a poor reputation and intensifying market competition. As a result, the brand’s revenues and subsequently its brand value were heavily impacted. Boeing is a prime example of the unpredictability of brand value. As a company that once imbued trust and excellent safety standards, the brand’s value has dropped by 29% due to the recent reports of accidents that have tarnished its reputation.
The True Power of Brand
Boeing’s recent hardships reflect the volatile nature of brand value. While 244 brands in the entire ranking have increased their brand value year-over-year, another 212 have taken a hit. Part of a brand’s purpose is to manage reputation, retain loyal customers, and generate awareness. Given that a brand is the sum of its parts, the ranking proves that an issue with any of these things could trigger a chain reaction, negatively impacting a brand’s bottom line. So is it worth companies investing in their brand? All signs point to yes, for now. on Last year, stock and bond returns tumbled after the Federal Reserve hiked interest rates at the fastest speed in 40 years. It was the first time in decades that both asset classes posted negative annual investment returns in tandem. Over four decades, this has happened 2.4% of the time across any 12-month rolling period. To look at how various stock and bond asset allocations have performed over history—and their broader correlations—the above graphic charts their best, worst, and average returns, using data from Vanguard.
How Has Asset Allocation Impacted Returns?
Based on data between 1926 and 2019, the table below looks at the spectrum of market returns of different asset allocations:
We can see that a portfolio made entirely of stocks returned 10.3% on average, the highest across all asset allocations. Of course, this came with wider return variance, hitting an annual low of -43% and a high of 54%.
A traditional 60/40 portfolio—which has lost its luster in recent years as low interest rates have led to lower bond returns—saw an average historical return of 8.8%. As interest rates have climbed in recent years, this may widen its appeal once again as bond returns may rise.
Meanwhile, a 100% bond portfolio averaged 5.3% in annual returns over the period. Bonds typically serve as a hedge against portfolio losses thanks to their typically negative historical correlation to stocks.
A Closer Look at Historical Correlations
To understand how 2022 was an outlier in terms of asset correlations we can look at the graphic below:
The last time stocks and bonds moved together in a negative direction was in 1969. At the time, inflation was accelerating and the Fed was hiking interest rates to cool rising costs. In fact, historically, when inflation surges, stocks and bonds have often moved in similar directions. Underscoring this divergence is real interest rate volatility. When real interest rates are a driving force in the market, as we have seen in the last year, it hurts both stock and bond returns. This is because higher interest rates can reduce the future cash flows of these investments. Adding another layer is the level of risk appetite among investors. When the economic outlook is uncertain and interest rate volatility is high, investors are more likely to take risk off their portfolios and demand higher returns for taking on higher risk. This can push down equity and bond prices. On the other hand, if the economic outlook is positive, investors may be willing to take on more risk, in turn potentially boosting equity prices.
Current Investment Returns in Context
Today, financial markets are seeing sharp swings as the ripple effects of higher interest rates are sinking in. For investors, historical data provides insight on long-term asset allocation trends. Over the last century, cycles of high interest rates have come and gone. Both equity and bond investment returns have been resilient for investors who stay the course.