According to Demographia’s 2022 Housing Affordability Report, the number of housing markets around the world deemed “severely unaffordable” increased by 60% compared to 2019 (prior to the pandemic). This graphic looks at some of the least affordable housing markets across the globe, relative to median household income. The report covers 92 different cities in eight nations: Australia, Canada, China, Ireland, New Zealand, Singapore, the United Kingdom, and the United States.
The Least Affordable Housing Markets
Before diving in, it’s worth outlining the methodology used in this report, to help explain what’s classified as a severely unaffordable housing market. To calculate affordability, a city’s median housing price and divided by its median household income. From there, a city is given a score:
A score of 5.1 or above is considered severely unaffordable 4.1 to 5.0 is considered seriously unaffordable 3.1 to 4.0 is considered moderately unaffordable
All the cities on this graphic are classified as severely unaffordable—and, for the 12th year in a row, Hong Kong takes the top spot as the world’s most unaffordable housing market, with a score of 23.2. One reason for Hong Kong’s steep housing costs is its lack of supply, partly due to its lack of residential zoning—which only accounts for 7% of the region’s zoned land. For context, 75% of New York City’s land area is dedicated to residential housing. Sydney moved up one spot this year, making it the second most expensive city to purchase a home on the list, with a score of 15.3. Besides Hong Kong, no other city has scored this high in the last 18 years this report has been released. There are several theories for Sydney’s soaring housing rates, but industry expert Tom Forrest, CEO of Urban Taskforce Australia, boils it down to one fundamental issue in an interview with Australia Broker—supply isn’t keeping up with demand:
The COVID-19 Impact
Middle-income earners were already feeling the squeeze prior to the global pandemic, but COVID-19 only exacerbated housing affordability issues. As people began to work from home, high-income earners started to look for more spacious housing that wasn’t necessarily in the city center, driving up demand in suburban areas that were relatively affordable prior to the pandemic. At the same time, supply chain issues and material costs impacted construction, which created a perfect storm that ultimately drove housing prices up. But with interest rates rising and COVID-19 restrictions easing around the world, some experts are predicting a market cool down this year—at least in some parts of the world.
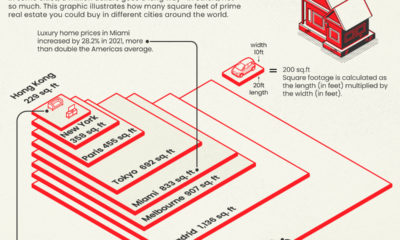
Like this? Then you might like this article: How Much Prime Real Estate Could You Buy for $1M?
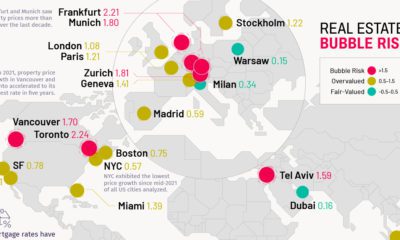
Source: Demographia Details: The affordability score is calculated by taking a city’s median housing price and dividing it by the median household income. Anything over 5.1 is considered severely unaffordable Notes: Data includes 92 metropolitan markets across eight countries; Australia, Canada, Ireland, Singapore, China, New Zealand, the U.K., and the U.S., as of the third quarter of 2021. Many European countries, along wth Japan, we excluded from the dataset, because information on median income was not readily available. on Today’s connected cars come stocked with as many as 200 onboard sensors, tracking everything from engine temperature to seatbelt status. And all those sensors create reams of data, which will increase exponentially as the autonomous driving revolution gathers pace. With carmakers planning on uploading 50-70% of that data, this has serious implications for policymakers, manufacturers, and local network infrastructure. In this visualization from our sponsor Global X ETFs, we ask the question: will connected cars break the internet?
Data is a Plural Noun
Just how much data could it possibly be? There are lots of estimates out there, from as much as 450 TB per day for robotaxis, to as little as 0.383 TB per hour for a minimally connected car. This visualization adds up the outputs from sensors found in a typical connected car of the future, with at least some self-driving capabilities. The focus is on the kinds of sensors that an automated vehicle might use, because these are the data hogs. Sensors like the one that turns on your check-oil-light probably doesn’t produce that much data. But a 4K camera at 30 frames a second, on the other hand, produces 5.4 TB per hour. All together, you could have somewhere between 1.4 TB and 19 TB per hour. Given that U.S. drivers spend 17,600 minutes driving per year, a vehicle could produce between 380 and 5,100 TB every year. To put that upper range into perspective, the largest commercially available computer storage—the 100 TB SSD Exadrive from Nimbus—would be full in 5 hours. A standard Blu-ray disc (50 GB) would be full in under 2 seconds.
Lag is a Drag
The problem is twofold. In the first place, the internet is better at downloading than uploading. And this makes sense when you think about it. How often are you uploading a video, versus downloading or streaming one? Average global mobile download speeds were 30.78 MB/s in July 2022, against 8.55 MB/s for uploads. Fixed broadband is much higher of course, but no one is suggesting that you connect really, really long network cables to moving vehicles.
Ultimately, there isn’t enough bandwidth to go around. Consider the types of data traffic that a connected car could produce:
Vehicle-to-vehicle (V2V) Vehicle-to-grid (V2G) Vehicles-to-people (V2P) Vehicles-to-infrastructure (V2I) Vehicles-to-everything (V2E)
The network just won’t be able to handle it.
Moreover, lag needs to be relatively non-existent for roads to be safe. If a traffic camera detects that another car has run a red light and is about to t-bone you, that message needs to get to you right now, not in a few seconds.
Full to the Gunwales
The second problem is storage. Just where is all this data supposed to go? In 2021, total global data storage capacity was 8 zettabytes (ZB) and is set to double to 16 ZB by 2025.
One study predicted that connected cars could be producing up to 10 exabytes per month, a thousand-fold increase over current data volumes.
At that rate, 8 ZB will be full in 2.2 years, which seems like a long time until you consider that we still need a place to put the rest of our data too.
At the Bleeding Edge
Fortunately, not all of that data needs to be uploaded. As already noted, automakers are only interested in uploading some of that. Also, privacy legislation in some jurisdictions may not allow highly personal data, like a car’s exact location, to be shared with manufacturers.
Uploading could also move to off-peak hours to even out demand on network infrastructure. Plug in your EV at the end of the day to charge, and upload data in the evening, when network traffic is down. This would be good for maintenance logs, but less useful for the kind of real-time data discussed above.
For that, Edge Computing could hold the answer. The Automotive Edge Computing Consortium has a plan for a next generation network based on distributed computing on localized networks. Storage and computing resources stay closer to the data source—the connected car—to improve response times and reduce bandwidth loads.
Invest in the Future of Road Transport
By 2030, 95% of new vehicles sold will be connected vehicles, up from 50% today, and companies are racing to meet the challenge, creating investing opportunities.
Learn more about the Global X Autonomous & Electric Vehicles ETF (DRIV). It provides exposure to companies involved in the development of autonomous vehicles, EVs, and EV components and materials.
And be sure to read about how experiential technologies like Edge Computing are driving change in road transport in Charting Disruption. This joint report by Global X ETFs and the Wall Street Journal is also available as a downloadable PDF.