So why haven’t more investors heard of them? Traditionally, structured notes had a $1 million minimum investment. They were only available to high-net-worth or institutional investors—but they are now becoming more accessible. Today’s infographic from Halo Investing explains what structured notes are, outlines the two main types, and demonstrates how to implement them in a portfolio.
What is a Structured Note?
A structured note is a hybrid security, where approximately 80% is a bond component and 20% is an embedded derivative. Structured notes are issued by major financial institutions. Since they are the liability of the issuer, it is critical that the investor is comfortable with the issuer—as with any bond purchase. Almost all structured notes have four simple parameters. As long as the underlying asset does not fall lower than the protection amount at maturity, the investor will receive their initial investment back in full. This is the primary draw of structured notes: they provide a level of downside protection, while still allowing investors to participate in market upswings.
Types of Structured Notes
There are a variety of structured notes, providing investors with diverse options and a range of risk/return profiles. Structured notes generally fall into one of two broad categories: growth notes and income notes.
Growth Notes
Investors receive a percentage—referred to as the participation rate—of the underlying asset’s price appreciation. For example, a growth note has the following terms:
Maturity: 5 years Participation rate: 117% Underlying asset: S&P 500 index Principal protection: 30%
Here’s what the payoff would look like in 4 different scenarios:
Income Notes
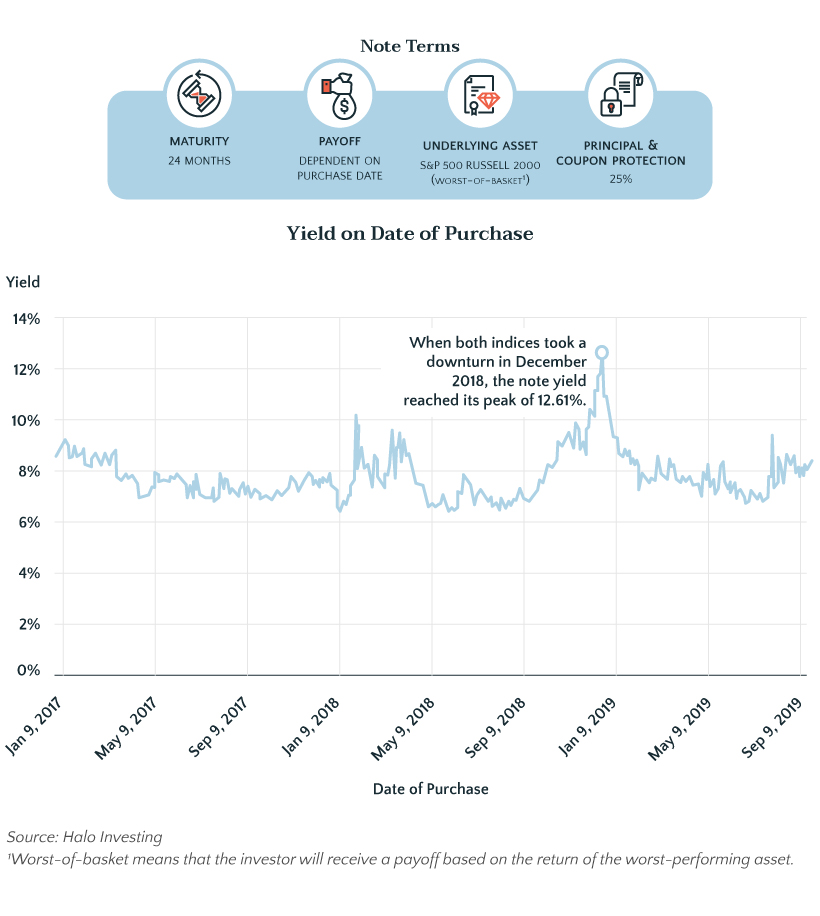
Over an income note’s life, investors receive a fixed payment known as a coupon. Income notes do not participate in the upside returns the way a growth note does—but they may generate a higher income stream than a standard debt security or dividend-paying stock. This is because protection is offered for both the principal and the coupon payments. For example, say a note’s underlying asset is the S&P 500, and it pays an 8% coupon with 30% principal protection. If the S&P 500 trades sideways all year—sometimes slightly negative or positive—the note will still pay its 8% coupon due to the protection. Income notes have another big advantage: their yields can spike in tumultuous markets, as was demonstrated during the market volatility near the end of 2018. Why did this spike occur? Banks construct the derivative piece of an income note by selling options*, which are more expensive in volatile markets. Banks then collect these higher premiums, creating larger coupons inside the structured note. Investors can diversify their return profile by using a combination of growth and income notes. *Option contracts offer the buyer the opportunity to either buy or sell the underlying asset at a stated price within a specific timeframe. Unlike futures, the buyer is not forced to exercise the contract if they choose not to.
Portfolio Applications
Structured notes are powerful tools that can accomplish almost any investment goal, and investors commonly use them as a core portfolio component.
Step 1: Select a portfolio asset class where downside protection is desired. Step 2: Reallocate a portion of the asset class to a structured note Step 3: Improve risk/reward performance.
The asset class will demonstrate an enhanced return profile, with less downside risk.
A Global Market
While relatively small in the Americas, the structured notes market is growing on a global scale: In the first half of 2019, assets under management in the Americas was up by 4%. It’s clear the asset class presents enormous untapped potential—and investors are taking notice.
Lowering Barriers Through Technology
Technology is becoming more ingrained in wealth management—empowering investors to access structured notes more easily through efficient trading. The market is already becoming more accessible. By 31 October 2019, the average transaction size had decreased by almost $500,000 over the year prior. Technology also offers other benefits for investors:
Improved analytics Investment education Risk information Increased competition = lower fees Improved secondary liquidity
As more investors take advantage of this asset class, they may be able to improve their return potential while limiting their risk. on Last year, stock and bond returns tumbled after the Federal Reserve hiked interest rates at the fastest speed in 40 years. It was the first time in decades that both asset classes posted negative annual investment returns in tandem. Over four decades, this has happened 2.4% of the time across any 12-month rolling period. To look at how various stock and bond asset allocations have performed over history—and their broader correlations—the above graphic charts their best, worst, and average returns, using data from Vanguard.
How Has Asset Allocation Impacted Returns?
Based on data between 1926 and 2019, the table below looks at the spectrum of market returns of different asset allocations:
We can see that a portfolio made entirely of stocks returned 10.3% on average, the highest across all asset allocations. Of course, this came with wider return variance, hitting an annual low of -43% and a high of 54%.
A traditional 60/40 portfolio—which has lost its luster in recent years as low interest rates have led to lower bond returns—saw an average historical return of 8.8%. As interest rates have climbed in recent years, this may widen its appeal once again as bond returns may rise.
Meanwhile, a 100% bond portfolio averaged 5.3% in annual returns over the period. Bonds typically serve as a hedge against portfolio losses thanks to their typically negative historical correlation to stocks.
A Closer Look at Historical Correlations
To understand how 2022 was an outlier in terms of asset correlations we can look at the graphic below:
The last time stocks and bonds moved together in a negative direction was in 1969. At the time, inflation was accelerating and the Fed was hiking interest rates to cool rising costs. In fact, historically, when inflation surges, stocks and bonds have often moved in similar directions. Underscoring this divergence is real interest rate volatility. When real interest rates are a driving force in the market, as we have seen in the last year, it hurts both stock and bond returns. This is because higher interest rates can reduce the future cash flows of these investments. Adding another layer is the level of risk appetite among investors. When the economic outlook is uncertain and interest rate volatility is high, investors are more likely to take risk off their portfolios and demand higher returns for taking on higher risk. This can push down equity and bond prices. On the other hand, if the economic outlook is positive, investors may be willing to take on more risk, in turn potentially boosting equity prices.
Current Investment Returns in Context
Today, financial markets are seeing sharp swings as the ripple effects of higher interest rates are sinking in. For investors, historical data provides insight on long-term asset allocation trends. Over the last century, cycles of high interest rates have come and gone. Both equity and bond investment returns have been resilient for investors who stay the course.