This represents a 38% increase over 2016, with many investors now considering environmental, social, and governance (ESG) factors alongside traditional financial analysis. Despite the strategy’s growth, lingering misconceptions remain. In today’s infographic from New York Life Investments, we address the five key myths of sustainable investing and shine a light on the realities.
1. Performance
In 2015, academics analyzed more than 2,000 studies—and found that in roughly 90% of the studies, companies with strong ESG profiles had equal or better financial performance than their non-ESG counterparts. A recent ranking of the 100 most sustainable corporations found similar results. Between February 2005 and August 2018, the Global 100 Index made a net investment return of 127.35%, compared to 118.27% for the MSCI All Country World Index (ACWI). —Toby Heaps, CEO of Corporate Knights
2. Approach
In modern investing, exclusionary or “screens-based” approaches do play a large role—and tend to avoid stocks or bonds of companies in the following “sin” categories:
Alcohol Tobacco Firearms Casinos
However, investment managers are increasingly taking an inclusive approach to sustainability, integrating ESG factors throughout the investment process. ESG integration strategies now total $17.5 trillion in global assets, a 69% increase over the past two years.
3. Longevity
Over the past decade, sustainable strategies have shown both strong AUM growth and positive asset flows. ESG funds attracted record net flows of nearly $5.5 billion in 2018 despite unfavorable market conditions, and continue to demonstrate strong growth in 2019. Not only that, the number of sustainable offerings has increased as well. In 2018, Morningstar recognized 351 sustainable funds—a 50% increase over the prior year.
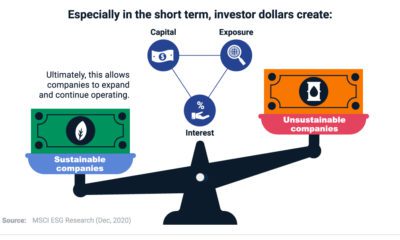
4. Interest
Millennials are more likely to factor in sustainability concerns than previous generations. However, institutional investors have adopted sustainable investments more than any other group—accounting for nearly 75% of the managed assets that follow an ESG approach. In addition, over half of surveyed consumers are “values-driven”, having taken one or more of the following actions with sustainability in mind:
Boycotted a brand Sold shares of a company Changed the types of products they used
Women and men are almost equally likely to be motivated by sustainable values, and half of “values-driven” consumers are open to ESG investing.
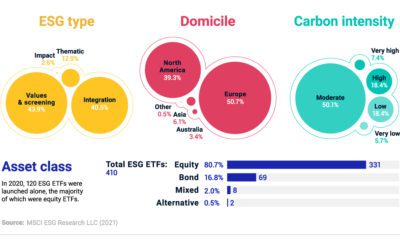
5. Asset Classes
This myth has a basis in history, but other asset classes are increasingly incorporating ESG analysis. For instance, 36% of today’s sustainable investments are in fixed income. While the number of sustainable equity investments remained unchanged from 2017-2018, fixed-income and alternative assets showed remarkable growth over the same period.
Tapping into the Potential of Sustainable Investing
It’s clear that sustainable investing is not just a buzzword. Instead, this strategy is integral to many portfolios. By staying informed, advisors and individual investors can take advantage of this growing strategy—and improve both their impact and return potential. on Last year, stock and bond returns tumbled after the Federal Reserve hiked interest rates at the fastest speed in 40 years. It was the first time in decades that both asset classes posted negative annual investment returns in tandem. Over four decades, this has happened 2.4% of the time across any 12-month rolling period. To look at how various stock and bond asset allocations have performed over history—and their broader correlations—the above graphic charts their best, worst, and average returns, using data from Vanguard.
How Has Asset Allocation Impacted Returns?
Based on data between 1926 and 2019, the table below looks at the spectrum of market returns of different asset allocations:
We can see that a portfolio made entirely of stocks returned 10.3% on average, the highest across all asset allocations. Of course, this came with wider return variance, hitting an annual low of -43% and a high of 54%.
A traditional 60/40 portfolio—which has lost its luster in recent years as low interest rates have led to lower bond returns—saw an average historical return of 8.8%. As interest rates have climbed in recent years, this may widen its appeal once again as bond returns may rise.
Meanwhile, a 100% bond portfolio averaged 5.3% in annual returns over the period. Bonds typically serve as a hedge against portfolio losses thanks to their typically negative historical correlation to stocks.
A Closer Look at Historical Correlations
To understand how 2022 was an outlier in terms of asset correlations we can look at the graphic below:
The last time stocks and bonds moved together in a negative direction was in 1969. At the time, inflation was accelerating and the Fed was hiking interest rates to cool rising costs. In fact, historically, when inflation surges, stocks and bonds have often moved in similar directions. Underscoring this divergence is real interest rate volatility. When real interest rates are a driving force in the market, as we have seen in the last year, it hurts both stock and bond returns. This is because higher interest rates can reduce the future cash flows of these investments. Adding another layer is the level of risk appetite among investors. When the economic outlook is uncertain and interest rate volatility is high, investors are more likely to take risk off their portfolios and demand higher returns for taking on higher risk. This can push down equity and bond prices. On the other hand, if the economic outlook is positive, investors may be willing to take on more risk, in turn potentially boosting equity prices.
Current Investment Returns in Context
Today, financial markets are seeing sharp swings as the ripple effects of higher interest rates are sinking in. For investors, historical data provides insight on long-term asset allocation trends. Over the last century, cycles of high interest rates have come and gone. Both equity and bond investment returns have been resilient for investors who stay the course.