Today’s graphic summarizes findings from the Global Risks Report, an annual publication produced by the World Economic Forum (WEF). It provides an overview of the most pressing global risks that the world is facing, as identified by experts and decision-makers. These risks are grouped into five general categories: economic, environmental, geopolitical, societal, and technological. Let’s dive into this year’s findings.
2023’s Risk Profile
In the lower–middle portion of the chart are the risks that could have serious impacts—such as attacks involving nuclear or biological weapons—but that were highlighted by fewer experts. Over in the top-right quadrant of the chart are the risks that a number of experts mentioned, and that are causing a strain on society. Not surprisingly, the top risks are related to issues that impact a wide variety of people, such as the rising cost of living and inflation. When staples like food and energy become more expensive, this can fuel unrest and political instability—particularly in countries that already had simmering discontent. WEF points out that increases in fuel prices alone led to protests in an estimated 92 countries. One risk worth watching is geoeconomic confrontation, which includes sanctions, trade wars, investment screening, and other actions that have the intent of weakening the countries on the receiving end. Efforts to mitigate this risk result in some of the key themes we see for the coming year. One example is the onshoring of industries, and “friend-shoring”, which is essentially moving operations to a foreign country that has more stable relations with one’s home country.
How Prepared Are We?
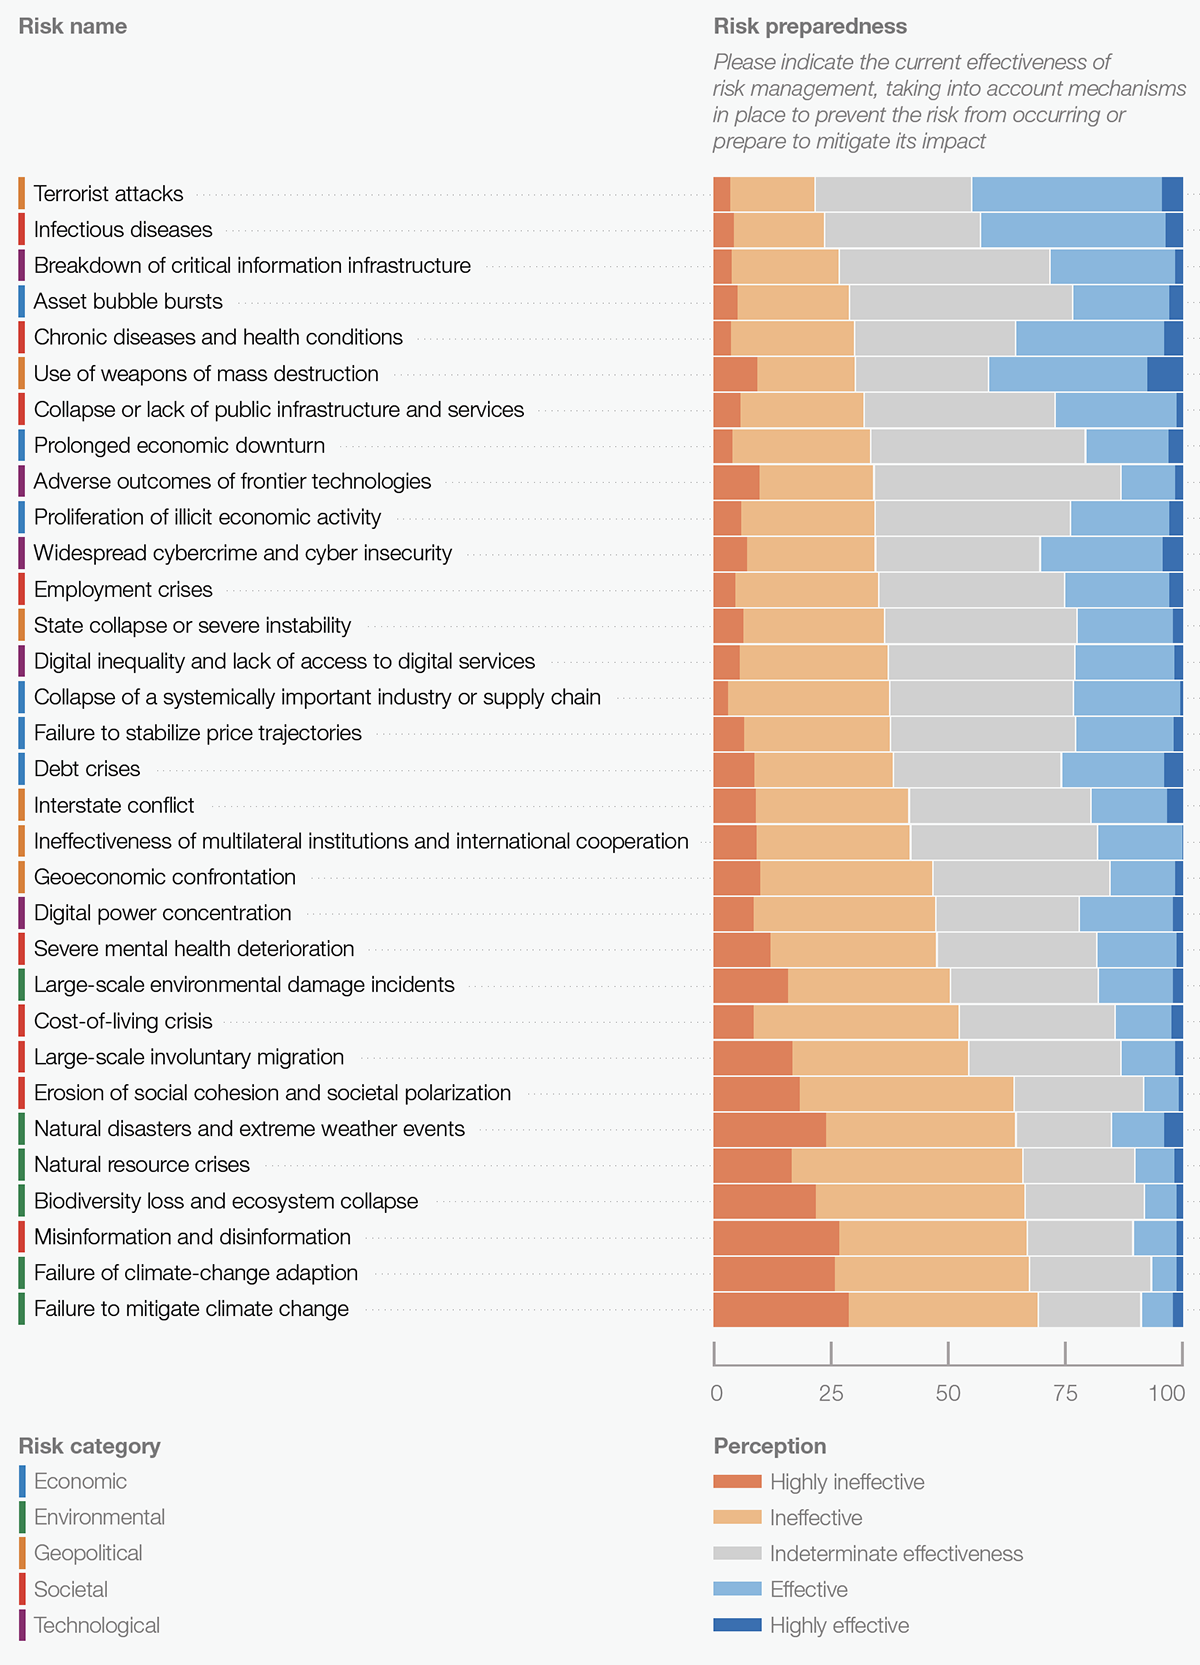
It’s one thing to be aware of risks, but it’s quite another to have the ability to head off negative events when they come to fruition. The chart below is a look at how prepared we are globally to deal with specific types of risks that could arise in the next few years. At the top of the chart are risks that experts feel society is better equipped to handle with current plans and resources. Moving towards the bottom of the chart are risks that experts feel are more of a threat since mechanisms for handling them are weak or non-existent.
Experts are generally more confident in solutions in the military or healthcare domains. Environmental and societal challenges leave policy and decision-makers less confident. One telling observation from the data above is that none of the risks left a majority of experts feeling confident in our ability to prevent the risk from occurring, or prepared to mitigate its impact. As the 2020s are shaping up to be a turbulent decade, that could be a cause for concern. Source: The Global Risks Report 2023, produced by the World Economic Forum (in partnership with Marsh McLennan and Zurich Insurance Group). Data note: The chart in this article is based on the Global Risks Perception Survey 2022-2023. A list of 32 global risks, along with their definitions, is shown in Table A.1 of the PDF. Page 77 of the report also includes detailed information on sample sizes and demographics of respondents. on Last year, stock and bond returns tumbled after the Federal Reserve hiked interest rates at the fastest speed in 40 years. It was the first time in decades that both asset classes posted negative annual investment returns in tandem. Over four decades, this has happened 2.4% of the time across any 12-month rolling period. To look at how various stock and bond asset allocations have performed over history—and their broader correlations—the above graphic charts their best, worst, and average returns, using data from Vanguard.
How Has Asset Allocation Impacted Returns?
Based on data between 1926 and 2019, the table below looks at the spectrum of market returns of different asset allocations:
We can see that a portfolio made entirely of stocks returned 10.3% on average, the highest across all asset allocations. Of course, this came with wider return variance, hitting an annual low of -43% and a high of 54%.
A traditional 60/40 portfolio—which has lost its luster in recent years as low interest rates have led to lower bond returns—saw an average historical return of 8.8%. As interest rates have climbed in recent years, this may widen its appeal once again as bond returns may rise.
Meanwhile, a 100% bond portfolio averaged 5.3% in annual returns over the period. Bonds typically serve as a hedge against portfolio losses thanks to their typically negative historical correlation to stocks.
A Closer Look at Historical Correlations
To understand how 2022 was an outlier in terms of asset correlations we can look at the graphic below:
The last time stocks and bonds moved together in a negative direction was in 1969. At the time, inflation was accelerating and the Fed was hiking interest rates to cool rising costs. In fact, historically, when inflation surges, stocks and bonds have often moved in similar directions. Underscoring this divergence is real interest rate volatility. When real interest rates are a driving force in the market, as we have seen in the last year, it hurts both stock and bond returns. This is because higher interest rates can reduce the future cash flows of these investments. Adding another layer is the level of risk appetite among investors. When the economic outlook is uncertain and interest rate volatility is high, investors are more likely to take risk off their portfolios and demand higher returns for taking on higher risk. This can push down equity and bond prices. On the other hand, if the economic outlook is positive, investors may be willing to take on more risk, in turn potentially boosting equity prices.
Current Investment Returns in Context
Today, financial markets are seeing sharp swings as the ripple effects of higher interest rates are sinking in. For investors, historical data provides insight on long-term asset allocation trends. Over the last century, cycles of high interest rates have come and gone. Both equity and bond investment returns have been resilient for investors who stay the course.