The Changing Anatomy of U.S. Oil Imports
In 10 short years, Canada has replaced the once mighty OPEC
The Chart of the Week is a weekly Visual Capitalist feature on Fridays. OPEC was once a name that made world leaders shake in their boots. In the early 1970s, the infamous oil cartel controlled more than 50% of global market share. The power of the cartel was also clear – in response to the Yom Kippur War of 1973, many OPEC countries (that were a part of OAPEC – the Organization for Arab Petroleum Exporting Countries) initiated production cuts and an oil embargo against Western countries. Oil prices quadrupled from $3 to $12, and OPEC producers raked in the cash. Meanwhile, the West was in a panic. Emergency energy rations were imposed, currencies were devalued, gasoline sales were restricted, and Sunday driving was banned in seven European countries.
No Longer Mighty?
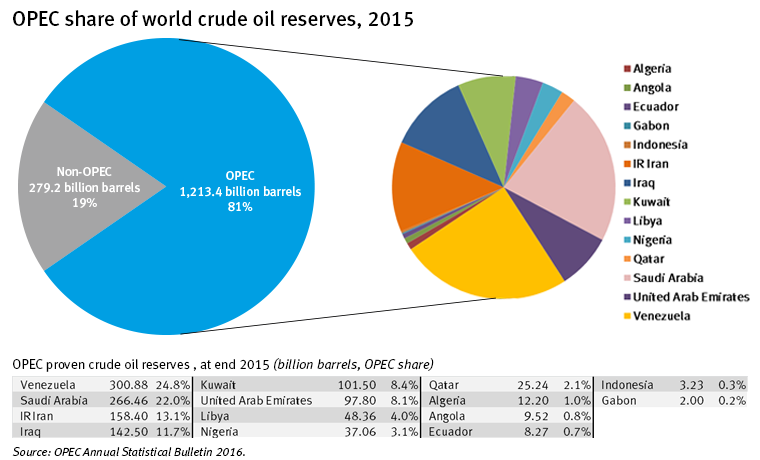
The organization still has some influence, though it seems to be harder to come by. After many months of squabbling, OPEC recently came to its first deal to cut production since 2008. That’s kept the oil price above $50/bbl, but gains will be effectively capped once low-cost shale producers ramp up production again. OPEC often touts its 81% share of global “proven” reserves as a sign of its might:
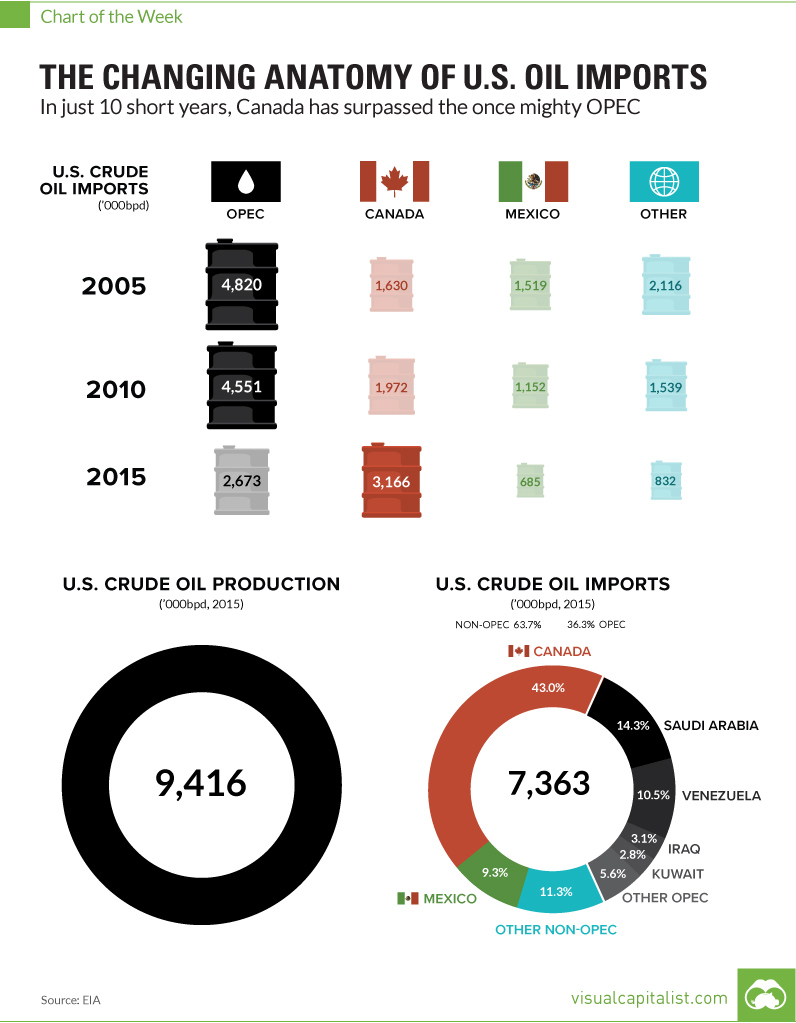
However, it seems OPEC’s peak influence is in the rear-view mirror due to several external factors. To start with the obvious, oil is slowly waning in importance in the global energy mix. According to the EIA, oil made up 34% of total global energy demand in 2010. By the year 2040, the EIA expects this share will be closer to 30%, though things could happen faster if the technology behind renewables and batteries makes a bigger impact than expected. Next, U.S. domestic production has almost doubled because of the shale and fracking revolution. In 2008, the U.S. produced 5.0 million bpd, and in 2015 the country averaged 9.4 million bpd. Lastly, as you can see on the chart, accelerated development of Canada’s Oil Sands has enabled the U.S. to buy any imports needed from Canada instead of the Middle East. In 2005, Canada only supplied 16.1% of U.S. oil imports, but Canada is now the major supplier of oil to the U.S. with a massive 43.0% share. With Donald Trump taking the reins in 2017, Obama’s decision on the Keystone XL pipeline could easily be reversed and then fast-tracked for completion. Such a move could bump Canada’s share of U.S. oil imports even higher, downsizing influence from OPEC even more.
Internal Friction
It’s not just a changing global macro environment that is hurting OPEC’s influence. Internally, their members have shifting goals and needs, and this has made the organization largely dysfunctional over recent years. The biggest factor? It’s Saudi Arabia, a country that is the largest oil producer in the group, but also a global low-cost leader. It has outsized influence in the cartel, but it also has way bigger margins to play with. This means that sometimes maintaining market share is more important than maximizing profit margins for the Saudis, and other countries disagree with this stance. With the Saudis finally capitulating to a production cut, maybe the OPEC forces can remain aligned over the near-term. Then again, it might be a temporary fix as OPEC influence continues to slowly sink – especially now that OPEC as a whole is only the second biggest supplier of imports to the U.S., and shrinking. on Last year, stock and bond returns tumbled after the Federal Reserve hiked interest rates at the fastest speed in 40 years. It was the first time in decades that both asset classes posted negative annual investment returns in tandem. Over four decades, this has happened 2.4% of the time across any 12-month rolling period. To look at how various stock and bond asset allocations have performed over history—and their broader correlations—the above graphic charts their best, worst, and average returns, using data from Vanguard.
How Has Asset Allocation Impacted Returns?
Based on data between 1926 and 2019, the table below looks at the spectrum of market returns of different asset allocations:
We can see that a portfolio made entirely of stocks returned 10.3% on average, the highest across all asset allocations. Of course, this came with wider return variance, hitting an annual low of -43% and a high of 54%.
A traditional 60/40 portfolio—which has lost its luster in recent years as low interest rates have led to lower bond returns—saw an average historical return of 8.8%. As interest rates have climbed in recent years, this may widen its appeal once again as bond returns may rise.
Meanwhile, a 100% bond portfolio averaged 5.3% in annual returns over the period. Bonds typically serve as a hedge against portfolio losses thanks to their typically negative historical correlation to stocks.
A Closer Look at Historical Correlations
To understand how 2022 was an outlier in terms of asset correlations we can look at the graphic below:
The last time stocks and bonds moved together in a negative direction was in 1969. At the time, inflation was accelerating and the Fed was hiking interest rates to cool rising costs. In fact, historically, when inflation surges, stocks and bonds have often moved in similar directions. Underscoring this divergence is real interest rate volatility. When real interest rates are a driving force in the market, as we have seen in the last year, it hurts both stock and bond returns. This is because higher interest rates can reduce the future cash flows of these investments. Adding another layer is the level of risk appetite among investors. When the economic outlook is uncertain and interest rate volatility is high, investors are more likely to take risk off their portfolios and demand higher returns for taking on higher risk. This can push down equity and bond prices. On the other hand, if the economic outlook is positive, investors may be willing to take on more risk, in turn potentially boosting equity prices.
Current Investment Returns in Context
Today, financial markets are seeing sharp swings as the ripple effects of higher interest rates are sinking in. For investors, historical data provides insight on long-term asset allocation trends. Over the last century, cycles of high interest rates have come and gone. Both equity and bond investment returns have been resilient for investors who stay the course.