This region is integral in both U.S. and Canadian histories, and it’s still the most vital trade corridor in North America today. In fact, every year 230 million metric tonnes of cargo pass through these important waterways, and it’s estimated that an impressive 30% of total U.S.-Canada economic activity takes place in the broader Great Lakes region itself. Today’s infographic comes to us from the Chamber of Marine Commerce, and it uses data from the a recent report covering the economic impacts of maritime shipping in the Great Lakes-St. Lawrence region.
A Crucial Trade Corridor
Freighter trade in the Great Lakes originally gained prominence in the 1840s, when copper and iron ore were discovered in the areas surrounding the lakes. This kickstarted large-scale shipping, and was the catalyst that led to the familiar lake freighters that are often seen on the waters now. In modern times, these metals are just one of many different categories of products that can be found aboard active vessels. Here are the most important types of cargo that make up the $77.4 billion (C$100 billion) of goods that flow through these lakes and waterways each year:
Iron ore, aluminum, and finished steel Limestone and cement Grain (wheat, barley, soybeans, corn, and canola) Petroleum products such as gasoline Fertilizers, sugar, and road salt Containers filled with consumer goods or manufactured products Oversized cargo, such as wind turbines or other machinery
There are 100+ port cities and towns that are connected through the waterways, and the region facilitates trade to 60+ countries, as well.
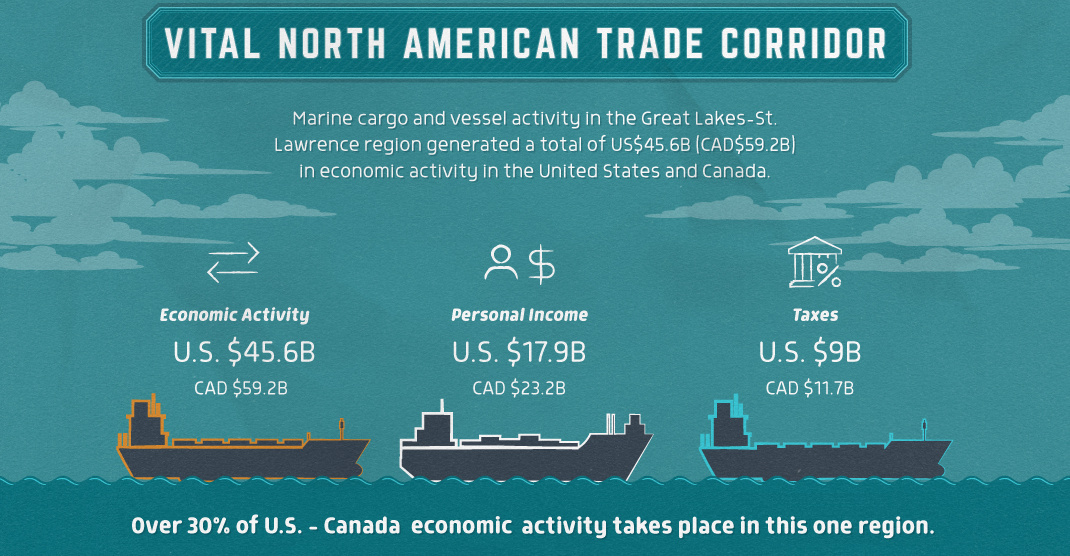
The Economic Impact
What are the economic benefits stemming from all the trade that originates in these 2,300 miles (3,700 km) of river and lake systems? According to the most recent edition of the report, marine cargo and vessel activity generated a total of $45.6 billion of economic impact in the U.S. and Canada, including $17.9 billion of personal income and $9 billion of tax revenue. Further, it’s estimated that 328,500 jobs have been created or are sustained by port activity, with the majority of them in places like Ontario, Quebec, Michigan, Indiana, and Ohio. Even in the digital age, physical goods (food, materials, machinery, consumer goods, etc.) are needed each day to keep the economy humming along – and in that respect, the Great Lakes-St.Lawrence region will remain a vital and important trade corridor for both countries for a long time. on These are in the form of Treasury securities, some of the most liquid assets worldwide. Central banks use them for foreign exchange reserves and private investors flock to them during flights to safety thanks to their perceived low default risk. Beyond these reasons, foreign investors may buy Treasuries as a store of value. They are often used as collateral during certain international trade transactions, or countries can use them to help manage exchange rate policy. For example, countries may buy Treasuries to protect their currency’s exchange rate from speculation. In the above graphic, we show the foreign holders of the U.S. national debt using data from the U.S. Department of the Treasury.
Top Foreign Holders of U.S. Debt
With $1.1 trillion in Treasury holdings, Japan is the largest foreign holder of U.S. debt. Japan surpassed China as the top holder in 2019 as China shed over $250 billion, or 30% of its holdings in four years. This bond offloading by China is the one way the country can manage the yuan’s exchange rate. This is because if it sells dollars, it can buy the yuan when the currency falls. At the same time, China doesn’t solely use the dollar to manage its currency—it now uses a basket of currencies. Here are the countries that hold the most U.S. debt: As the above table shows, the United Kingdom is the third highest holder, at over $655 billion in Treasuries. Across Europe, 13 countries are notable holders of these securities, the highest in any region, followed by Asia-Pacific at 11 different holders. A handful of small nations own a surprising amount of U.S. debt. With a population of 70,000, the Cayman Islands own a towering amount of Treasury bonds to the tune of $284 billion. There are more hedge funds domiciled in the Cayman Islands per capita than any other nation worldwide. In fact, the four smallest nations in the visualization above—Cayman Islands, Bermuda, Bahamas, and Luxembourg—have a combined population of just 1.2 million people, but own a staggering $741 billion in Treasuries.
Interest Rates and Treasury Market Dynamics
Over 2022, foreign demand for Treasuries sank 6% as higher interest rates and a strong U.S. dollar made owning these bonds less profitable. This is because rising interest rates on U.S. debt makes the present value of their future income payments lower. Meanwhile, their prices also fall. As the chart below shows, this drop in demand is a sharp reversal from 2018-2020, when demand jumped as interest rates hovered at historic lows. A similar trend took place in the decade after the 2008-09 financial crisis when U.S. debt holdings effectively tripled from $2 to $6 trillion.
Driving this trend was China’s rapid purchase of Treasuries, which ballooned from $100 billion in 2002 to a peak of $1.3 trillion in 2013. As the country’s exports and output expanded, it sold yuan and bought dollars to help alleviate exchange rate pressure on its currency. Fast-forward to today, and global interest-rate uncertainty—which in turn can impact national currency valuations and therefore demand for Treasuries—continues to be a factor impacting the future direction of foreign U.S. debt holdings.