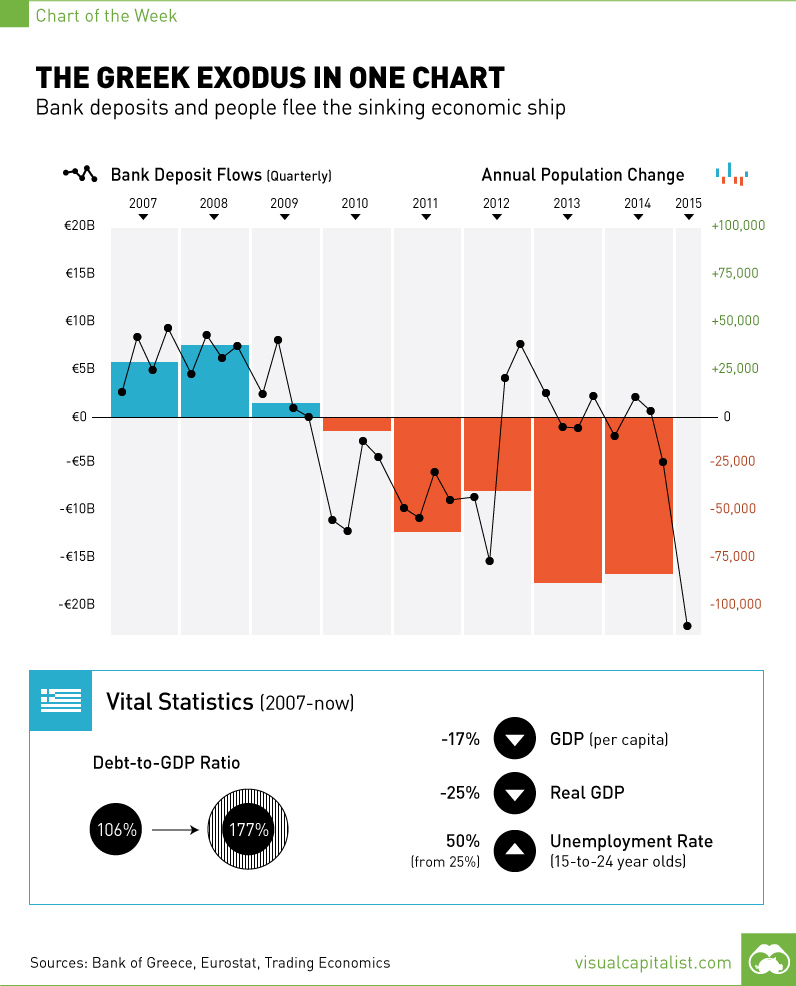
The Greek Exodus in One Chart
The Chart of the Week is a weekly feature in Visual Capitalist on Fridays. On Sunday, Greeks will participate in a referendum that could seal their fate. The people of Greece are between a rock and a hard place. On one hand, a “yes” vote will mean that they give into the extreme demands of their creditors, fostering an even harsher era of austerity for a Greek economy that has already slipped 25% in GDP since 2007. This will result in additional economic contraction, a likely resignation by Alexis Tsipras, and Finance Minister Yanis Varoufakis possibly cutting off his arm. The “no” vote, which is being urged by the Syriza government, would mean the European Central Bank would be cutting off assistance to Greek banks and a possible Grexit. For a country that is reported to have only €500 million in bank deposits left, things are no less ugly here. There is a blame game perpetuating itself through the media. Some people say the Greeks had it coming by taking advantage of easy credit, spending money frivolously (for example: 16.2% of GDP spending is on pensions, the highest in the euro zone), and then electing Syriza, an extremist government. The opposing side says that the intense standoff is the fault of the so-called troika, made up of the IMF, ECB, and Eurogroup. Recently, it’s becoming clear that even the troika acknowledges that Greece needs further debt relief, yet this was never offered up in negotiations. The IMF has now flat out said that the proposed additional austerity measures would leave Greece still with unsustainable debt. While both sides are likely warranted some blame, what is clear is that the Greek people have seen the writing on the wall for some time. Today’s chart shows the Greek exodus, as capital and people flee the sinking Greek economic ship in unprecedented numbers. Since the 2008 financial crisis, more Greeks have left the country each year with the trend accelerating in recent years. The country has a population of about 11 million, but the population has decreased annually by nearly 100,000 people in both 2013 and 2014. Based on how things are going this year, this trend is unlikely to change. Further, capital is also fleeing the banks in what started as a “jog” but is now a “run”. In Q1 of 2015, there were over €20 billion of outflows from Greek bank deposits. June’s data is not available yet, but it is likely the recent quarter will far surpass this amount as it is now reported that there is only €500 million in bank deposits left. This would explain why capital controls are in place, banks are closed, and people are limited to €60 withdrawals.
on Today’s chart measures the extent to which 41 major economies are reopening, by plotting two metrics for each country: the mobility rate and the COVID-19 recovery rate: Data for the first measure comes from Google’s COVID-19 Community Mobility Reports, which relies on aggregated, anonymous location history data from individuals. Note that China does not show up in the graphic as the government bans Google services. COVID-19 recovery rates rely on values from CoronaTracker, using aggregated information from multiple global and governmental databases such as WHO and CDC.
Reopening Economies, One Step at a Time
In general, the higher the mobility rate, the more economic activity this signifies. In most cases, mobility rate also correlates with a higher rate of recovered people in the population. Here’s how these countries fare based on the above metrics. Mobility data as of May 21, 2020 (Latest available). COVID-19 case data as of May 29, 2020. In the main scatterplot visualization, we’ve taken things a step further, assigning these countries into four distinct quadrants:
1. High Mobility, High Recovery
High recovery rates are resulting in lifted restrictions for countries in this quadrant, and people are steadily returning to work. New Zealand has earned praise for its early and effective pandemic response, allowing it to curtail the total number of cases. This has resulted in a 98% recovery rate, the highest of all countries. After almost 50 days of lockdown, the government is recommending a flexible four-day work week to boost the economy back up.
2. High Mobility, Low Recovery
Despite low COVID-19 related recoveries, mobility rates of countries in this quadrant remain higher than average. Some countries have loosened lockdown measures, while others did not have strict measures in place to begin with. Brazil is an interesting case study to consider here. After deferring lockdown decisions to state and local levels, the country is now averaging the highest number of daily cases out of any country. On May 28th, for example, the country had 24,151 new cases and 1,067 new deaths.
3. Low Mobility, High Recovery
Countries in this quadrant are playing it safe, and holding off on reopening their economies until the population has fully recovered. Italy, the once-epicenter for the crisis in Europe is understandably wary of cases rising back up to critical levels. As a result, it has opted to keep its activity to a minimum to try and boost the 65% recovery rate, even as it slowly emerges from over 10 weeks of lockdown.
4. Low Mobility, Low Recovery
Last but not least, people in these countries are cautiously remaining indoors as their governments continue to work on crisis response. With a low 0.05% recovery rate, the United Kingdom has no immediate plans to reopen. A two-week lag time in reporting discharged patients from NHS services may also be contributing to this low number. Although new cases are leveling off, the country has the highest coronavirus-caused death toll across Europe. The U.S. also sits in this quadrant with over 1.7 million cases and counting. Recently, some states have opted to ease restrictions on social and business activity, which could potentially result in case numbers climbing back up. Over in Sweden, a controversial herd immunity strategy meant that the country continued business as usual amid the rest of Europe’s heightened regulations. Sweden’s COVID-19 recovery rate sits at only 13.9%, and the country’s -93% mobility rate implies that people have been taking their own precautions.
COVID-19’s Impact on the Future
It’s important to note that a “second wave” of new cases could upend plans to reopen economies. As countries reckon with these competing risks of health and economic activity, there is no clear answer around the right path to take. COVID-19 is a catalyst for an entirely different future, but interestingly, it’s one that has been in the works for a while. —Carmen Reinhart, incoming Chief Economist for the World Bank Will there be any chance of returning to “normal” as we know it?