Combine this with the high interconnectedness of modern life—even when social distancing and lockdowns are applied—and pandemics can evolve quickly. In just a few weeks, previous hotspots can cool down, while new high risk areas can crop up seemingly out of nowhere. In the United States, like many other places in the world, the virus is hitting regions differently, and this landscape is constantly changing over time.
COVID-19 Growth, by State
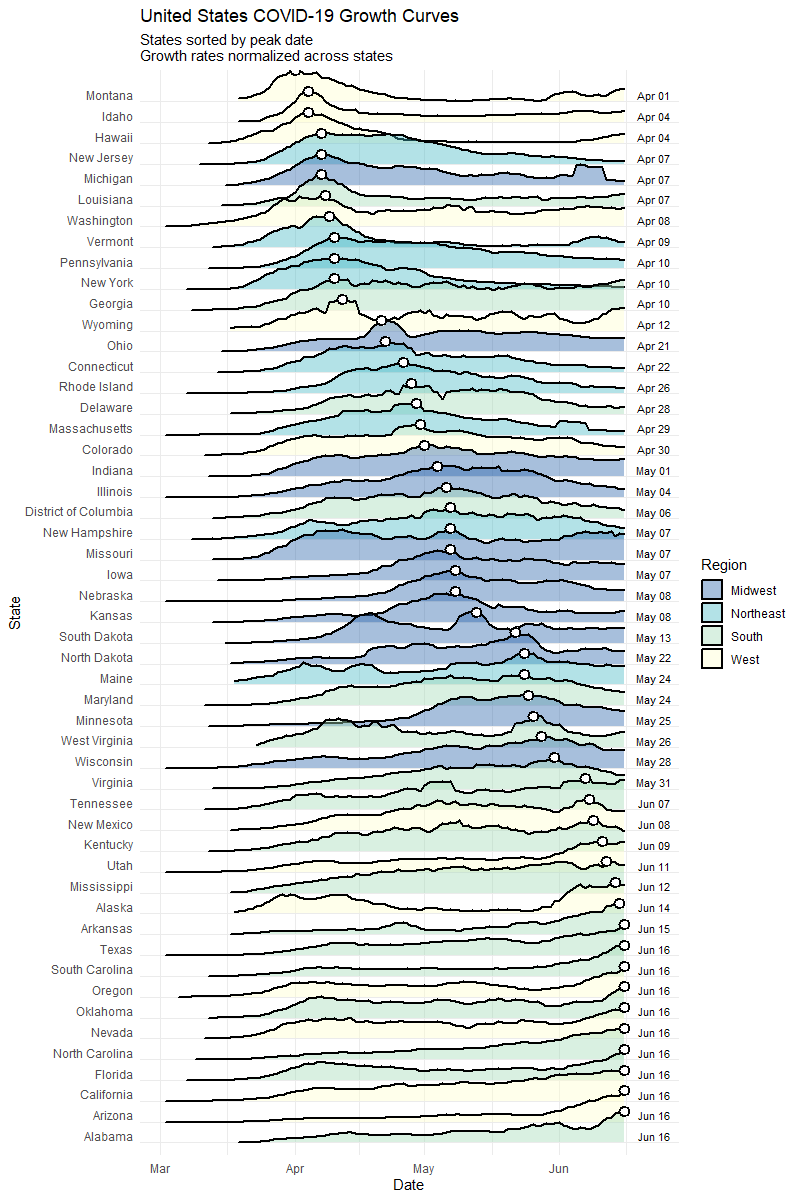
Today’s first visualization comes to us from Reddit user bgregory98, and it uses data from the New York Times to plot confirmed active COVID-19 cases by state. States are organized by the date that weekly average cases peaked, from top to bottom. Data is normalized and is current until June 16th, and states are colored based on regional definitions (i.e. Northeast, Midwest, West, South) as defined by the U.S. Census Bureau.
As you can see, when looking purely at active cases, the situation has evolved considerably from a geographical perspective. Early on, COVID-19 cases were more concentrated in coastal population centers, especially in the Northeast. New York, New Jersey, and Massachusetts, the three hardest hit states per capita so far, saw cases peak in April. However, a look at the bottom half of the visualization shows that generally, states in the South and West are starting to heat up with cases. Recent daily numbers confirm this, with California, Texas, Florida, Arizona, and North Carolina all gaining more than 1,000 new cases on June 17th.
Growth by State, Part Deux
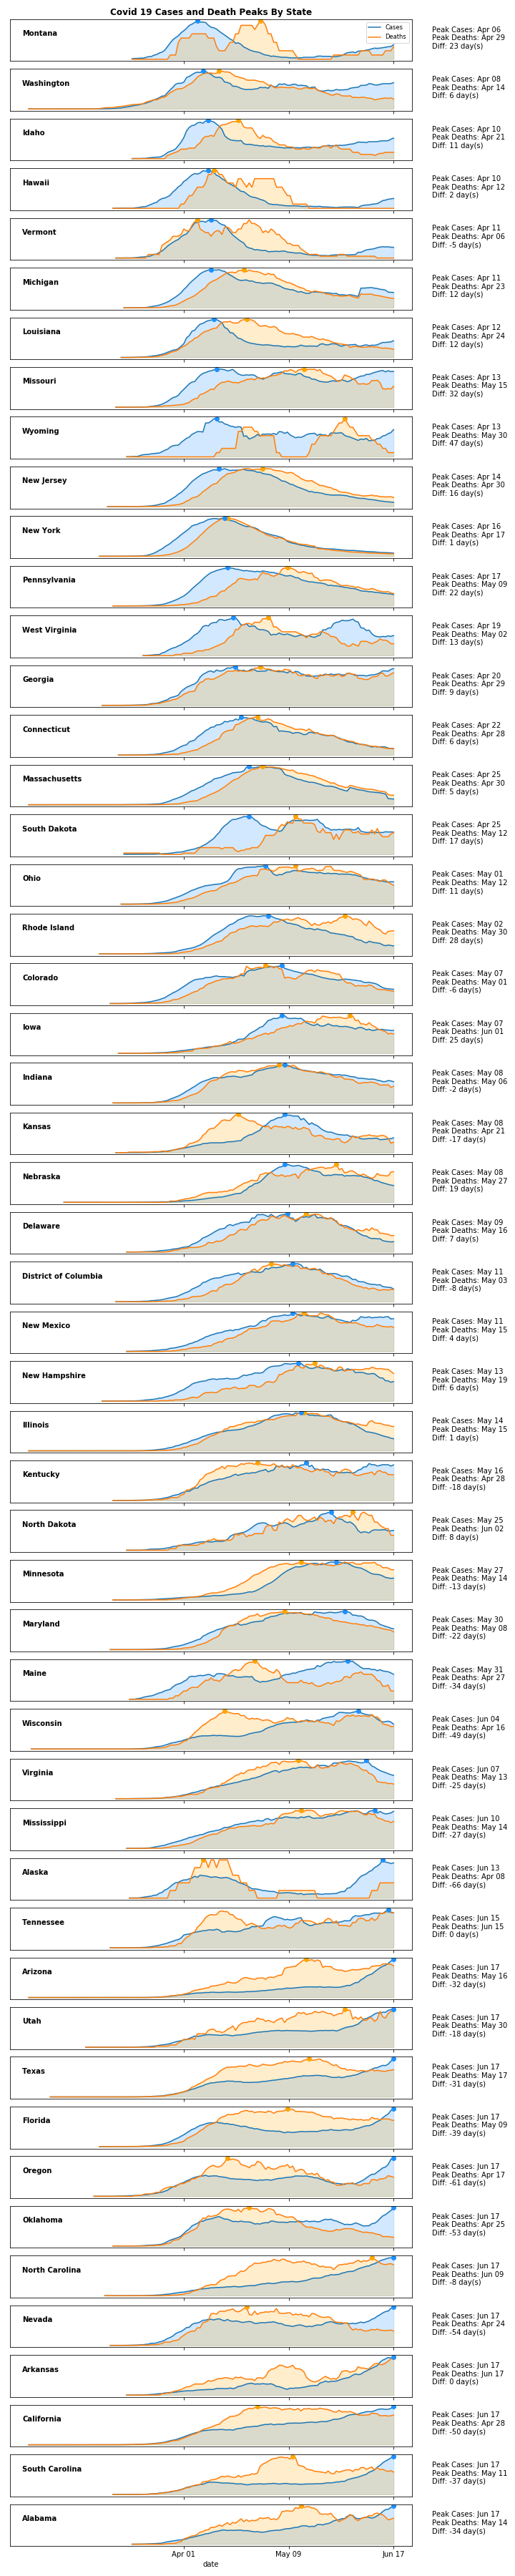
The following visualization by Reddit user jawsem17 is designed using a similar concept, and is current as of June 17th. This version uses the same data set from the New York Times. However, it also includes deaths as a metric, showing a comparison of peak deaths to peak cases for each state.
Although one would expect peak deaths to follow peak cases, this is not always the case. Peak deaths in Nevada, for example, occurred on April 24th, but peak cases have been in the last week. This same peculiar pattern can be seen in a variety of states, from California to Oklahoma.
Mapped: The Evolution of COVID-19 in the U.S.
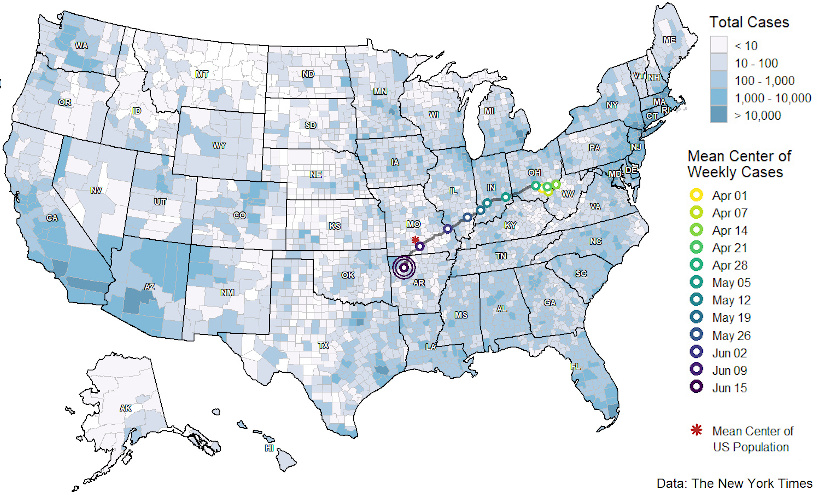
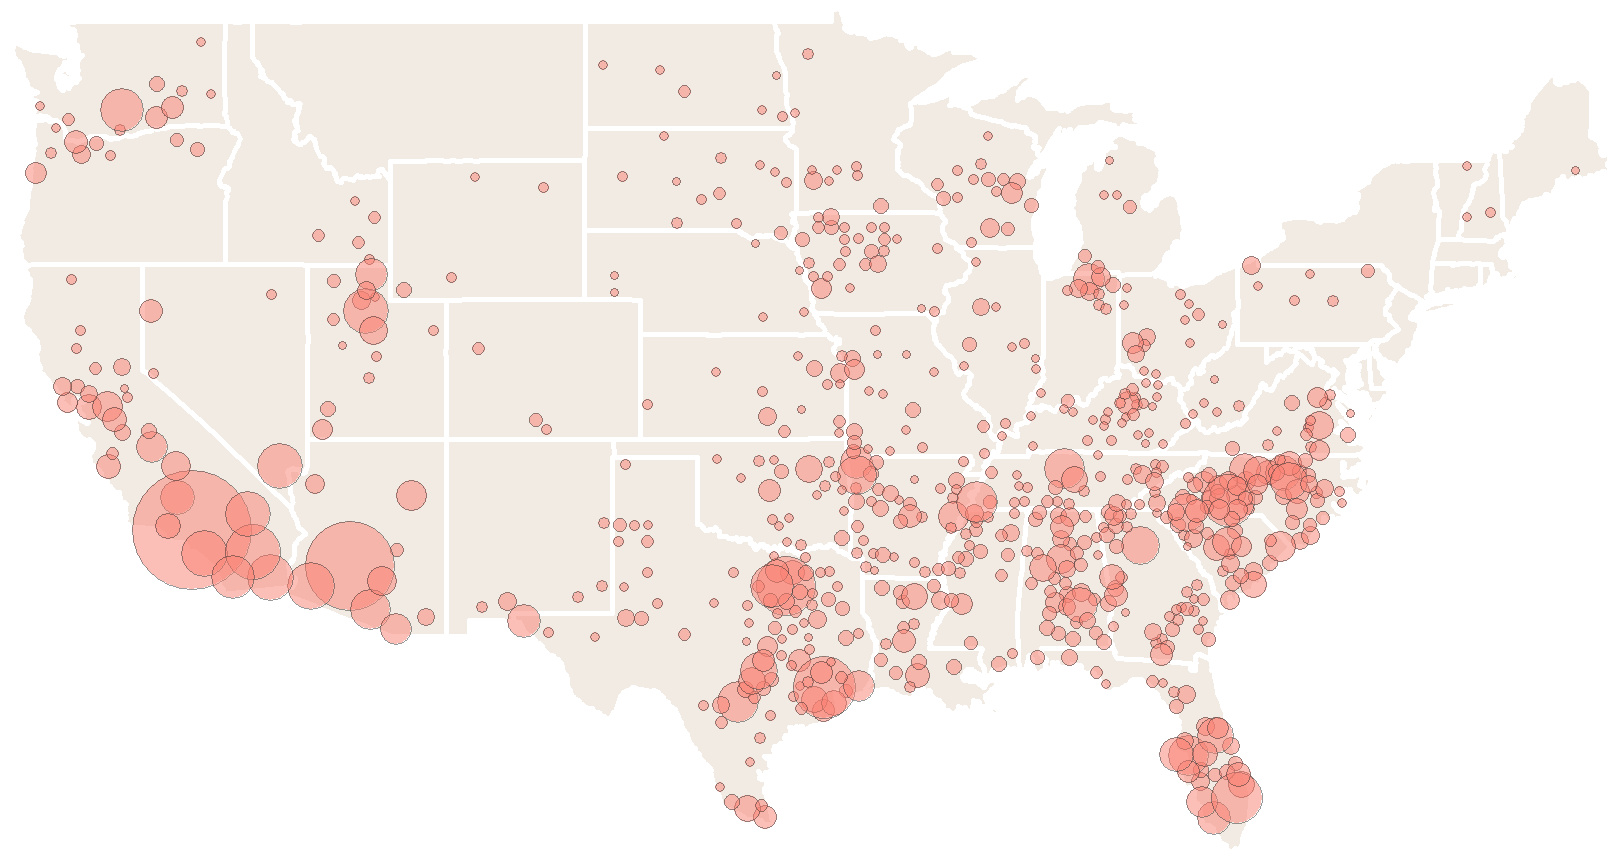
As the pandemic spreads and the situation has evolved, the mean center of weekly COVID-19 cases has been moving in a southwest direction. The following map, which also comes from Reddit user bgregory98, averages the center coordinates of all counties weighted by how many new confirmed cases they have had over the past week:
Originating in Ohio, the mean center of cases was initially heavily skewed by cases in the New York metro area. Since then, the mean center of cases has shifted and has now journeyed slightly past the mean center of U.S. population, located in Missouri. This is partially a regression to the mean, but it is also driven by growing case counts in aforementioned states in the southern and western parts of the country.
Mapped: Peak County Totals
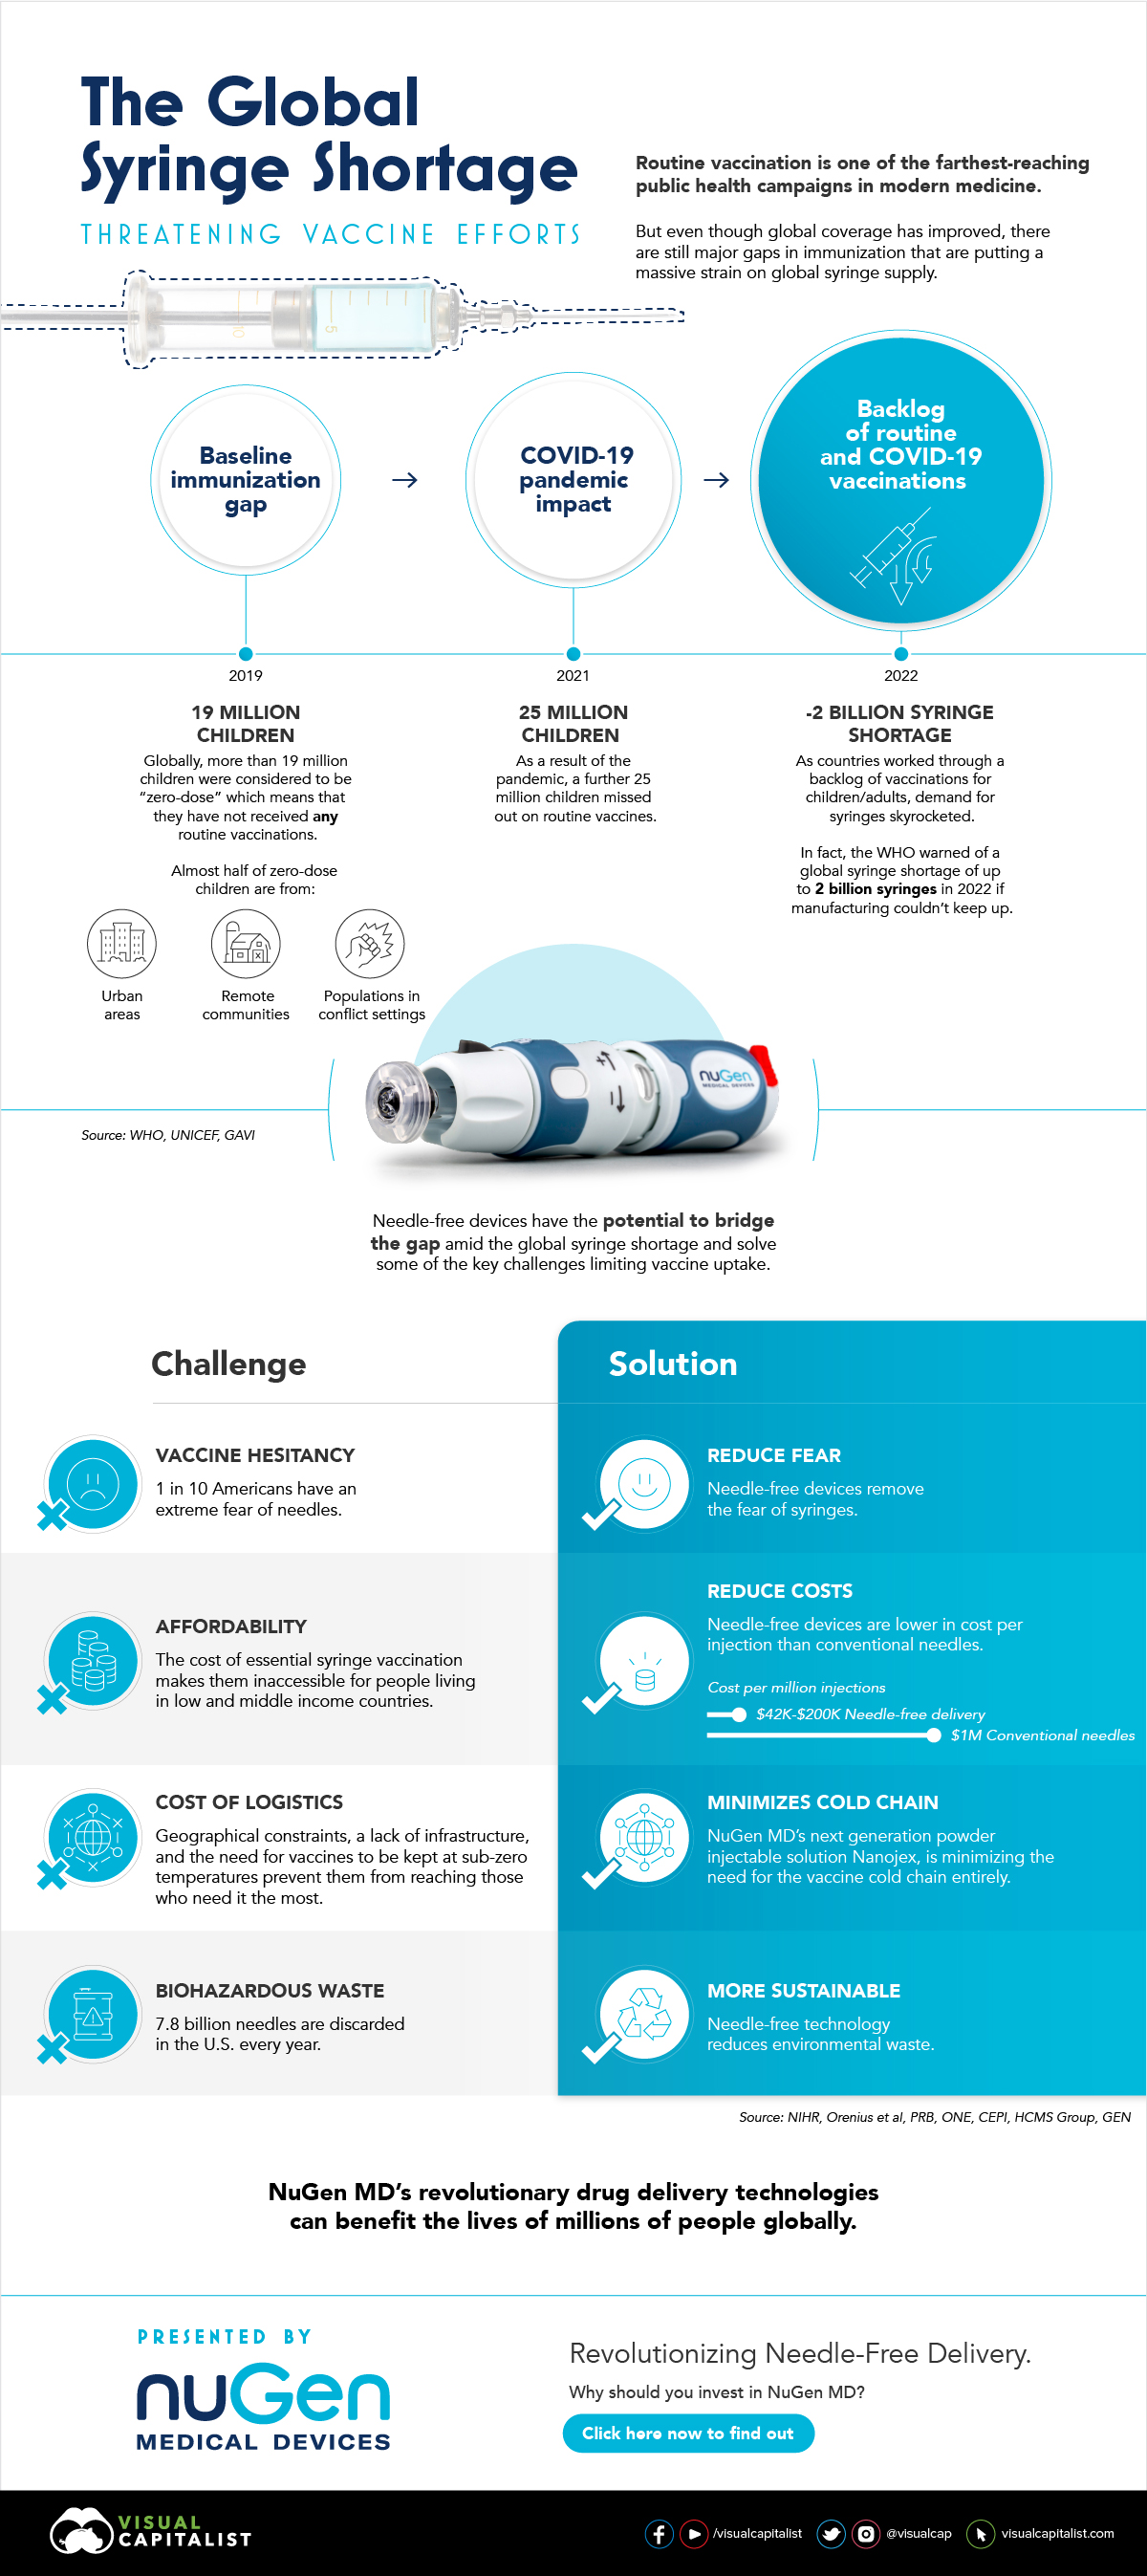
Finally, the progression of COVID-19 within the U.S. can be mapped in another useful way, revealing a geographical perspective to the virus’ spread. These maps from Winston Saunders show places where current disease levels are below their previous peaks (blue), and where current COVID-19 cases are at highs (red) as of June 18: Cases Below Previous Peaks Cases at Peak Levels This again shows the shift from the Northeast and Midwest parts of the country towards the West and South regions. As always, the path of the virus’ spread will continue to change and evolve, and the picture could again look quite different in just a few weeks time. on In the above infographic from NuGen Medical Devices, we explore the factors leading to the syringe shortage and take a look at the company’s innovative needle-free solution that could play an important role in closing the immunization gap.
The Immunization Gap
Even before the COVID-19 pandemic, millions of people around the world struggled to get access to routine vaccinations. In fact, as of 2019 more than 19 million children around the world were considered to be “zero-dose” which means that they did not receive any routine vaccinations. Moreover, when the COVID-19 pandemic hit, global immunization dropped even further with 25 million children missing out on routine vaccines in 2021 alone.
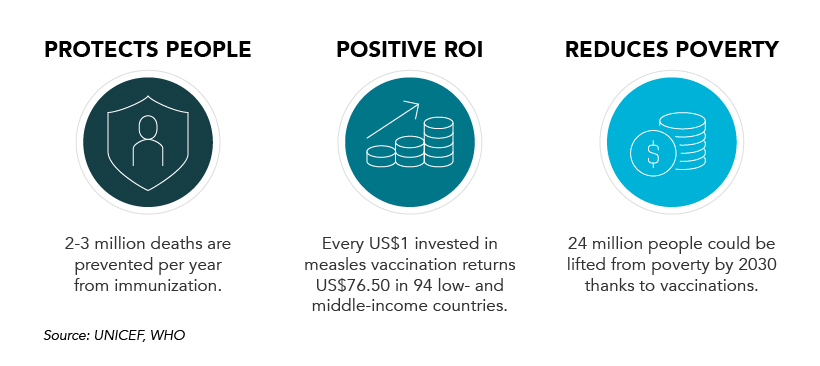
Why is Immunization So Important?
Vaccinations prevent against over 20 life-threatening diseases and save between 2-3 million deaths per year, making them—as the WHO describes—the foundation of healthcare systems and an indisputable human right. As countries work through a backlog of vaccinations to close the immunization gap that has worsened since the pandemic, demand for syringes has significantly increased.
The Result: A Global Syringe Deficit
In 2022, the WHO warned that we could see a shortage of up to 2 billion syringes if manufacturing can’t keep up. This could result in the severe disruption to routine vaccinations and promote unsafe recycling of syringes in order to administer vaccines. But the issue goes far beyond a supply shortage of syringes. COVID-19 has brought conventional syringe vaccines into sharp focus, with many criticizing the challenges associated with them. With conventional needles facing so many challenges, it’s no surprise that investors are taking interest in viable alternatives. What’s more, these alternatives don’t just apply to vaccinations, they can also work for people with diabetes, dentists, and pet care.
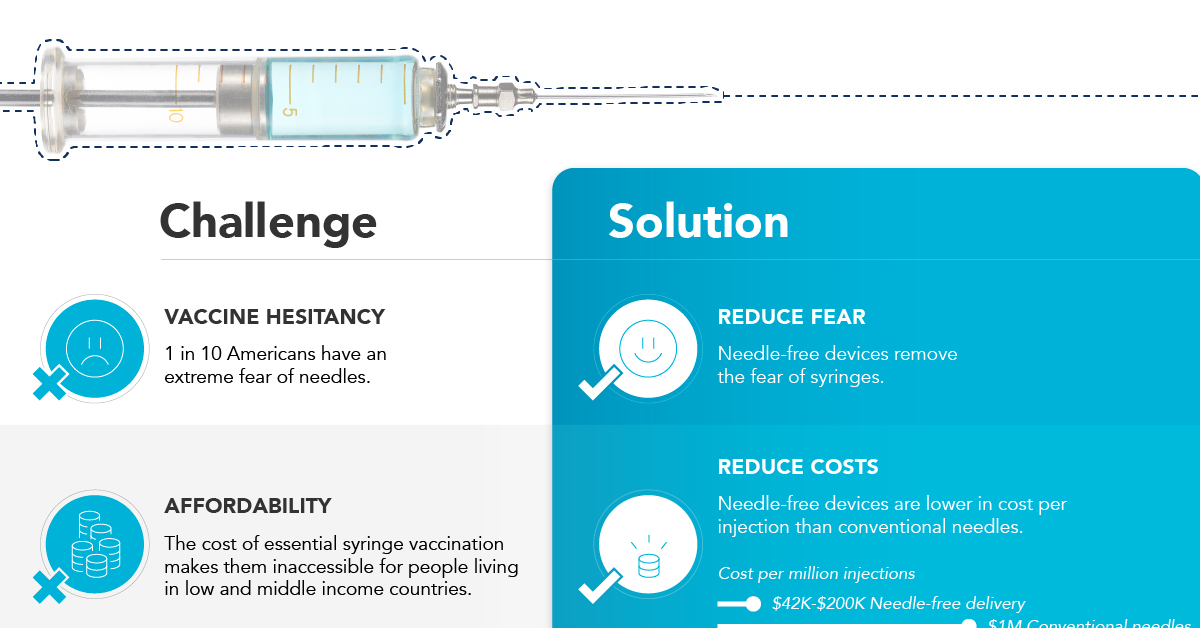
Enter Needle-free Devices from NuGen MD
Needle-free devices have the potential to bridge the gap in immunization amid the global syringe shortage, solve some of the key challenges limiting vaccine uptake, and more importantly, benefit the lives of millions of people.
How Do They Work?
NuGen’s needle-free devices use a simple spring-loaded mechanism which uses pressure to release the liquid drug and penetrate the skin. In less than one-tenth of a second, the drug is dispensed more safely and evenly compared to needle syringes. It’s also virtually painless and leaves no mark on the skin.
Interested in investing in NuGen Medical Devices? To learn more about their plans to pioneer the future of needle-free drug delivery, click this link now.