In fact, many millennia before the credit score became ubiquitous, there is historical evidence that cultures around the world were borrowing for various reasons. From the writings in Hammurabi’s Code to the exchanges documented by the Ancient Romans, we know that credit was used for purposes such as getting enough silver to buy a property or for agricultural loans made to farmers.
Consumer Credit: 3,500 B.C. to Today
In today’s infographic from Equifax, we look at the long history of consumer credit – everything from the earliest writings of antiquity to the modern credit boom that started in the 20th century.
Consumer credit has evolved considerably from the early days. Over the course of several millennia, there have been credit booms, game-changing innovations, and even periods such as the Dark Ages when the practice of charging interest (also known as “usury”) was considered immoral by some people.
A Timeline of Consumer Credit
Below is a timeline of the significant events that have helped lead to the modern consumer credit boom, in which Americans now have over $12.4 trillion borrowed through mortgages, credit cards, student loans, auto loans, and other types of credit.
The Ancients and Credit
3,500 BC – Sumer Sumer was the first urban civilization – with about 89% of its population living in cities. It is thought that here consumer loans, used for agricultural purposes, were first used. 1,800 BC – Babylon The Code of Hammurabi was written, formalizing the first known laws around credit. Hammurabi established the maximum interest rates that could be used legally: 33.3% per year on loans of grain, and 20% per year on loans of silver. To be valid, loans had to be witnessed by a public official and recorded as a contract. 50 BC – The Roman Republic Around this time, Cicero noted that his neighbor bought 625 acres of land for 11.5 million sesterces. Did this person literally carry 11.5 tons of coins through the streets of Rome? No, it was done through credit and paper. Cicero writes “nomina facit, negotium conficit” – or, “he uses credit to complete the purchase”.
Moral Concerns About Lending
800 – The Dark Ages in Europe After the collapse of the Western Roman Empire, economic activity grinded to a halt. The Church even banned usury, the practice of charging interest on loans, for all laymen under Charlemagne’s rule (768-814 AD). 1500 – The Age of Discovery As European explorers and merchants begin trade missions to faraway lands, the need for capital and credit increases. 1545 – England After the Reformation, the first country to establish a legal rate of interest was England in 1545 during the reign of Henry VIII. The rate was set at 10%. 1787 – England Philosopher Jeremy Bentham writes a treatise called “A Defense of Usury”, arguing that restrictions on interest rates harm the ability to raise capital for innovation. If risky, new ventures cannot be funded, then growth becomes limited.
The Birth of Modern Consumer Credit
1803 – England Credit reporting itself originated in England in the early 19th century. The earliest available account is that of a group of English tailors that came together to swap information on customers who failed to settle their debts. 1826 – England The Manchester Guardian Society is formed, and later begins issuing a monthly newsletter with information about people who fail to pay their debts. 1841 – New York The Mercantile Agency is founded, and starts systemizing rumors about the character and assets held by debtors through a network of correspondents. Massive ledgers in New York City are made, though these reports were heavily subjective and biased. 1864 – New York The Mercantile Agency is renamed the R. G. Dun and Company on the eve of the Civil War, and finalizes an alphanumeric system for tracking creditworthiness of companies that would remain in use until the twentieth century. 1899 – Atlanta The Retail Credit Company was founded, and begins compiling an extensive list of creditworthy customers. Later on, the company would change its name to Equifax. Today, it is the oldest of the three major credit agencies today in the United States.
The Consumer Credit Boom
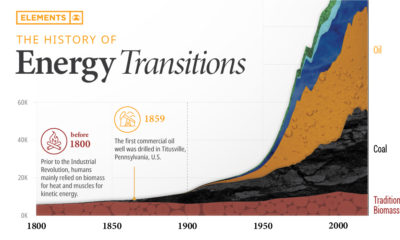
1908 – Detroit Henry Ford’s Model T makes automobiles accessible to the “great multitude” of people, but they were still too expensive to buy with cash for most families. 1919 – Detroit GM solves this problem by loaning consumers the money they need to buy a new car. General Motors Acceptance Corporation (GMAC) is founded and popularizes the idea of installment plan financing. Consumers can now get a new car with just a 35% downpayment at time of financing. 1930 – United States By this time, efficient U.S. factories are pumping out cheaper consumer products and appliances. Following the lead of GM, now washing machines, furniture, refrigerators, phonographs, and radios can be bought on installment plans. It’s also worth noting that in this period, 2/3 of all autos are bought on installment plans.
The First in Big Data
1950 – United States By 1950, typical middle-class Americans already had revolving credit accounts at different merchants. Maintaining several different cards and monthly payments was inconvenient, and created a new opportunity. At the same time, Diners Club introduces their charge card, which helps open the floodgates for other consumer credit products. 1955 – United States Early credit reporters use millions of index cards, sorted in a massive filing system, to keep track of consumers around the country. To get the latest information, agencies would scour local newspapers for notices of arrests, promotions, marriages, and deaths, attaching this information to individual credit files. 1958 – United States BankAmericard (now Visa) is “dropped” in Fresno, California. American Express and Mastercard soon follow, offering Americans general credit for a wide range of purchases. 1960 – United States At a time when the technology was limited to filing cabinets, the postage meter, and the telephone, American credit bureaus issued 60 million credit reports in a single year. 1964– United States The Association of Credit Bureaus in the U.S. conducts the first studies into the application of computer technologies to credit reporting. Accuracy of data is also improved around this time by standardizing credit application forms. 1970 – United States The first Fair Credit Reporting Act is passed in the United States. It establishes a standard legal framework for credit reporting agencies. 1980s – United States The three biggest credit bureaus attain universal coverage across the country. 1989 – United States The FICO score is introduced, and quickly becomes a standard system to measure credit scores based on objective factors and data. 2006 – United States VantageScore is created through a joint-venture between the top three credit scoring agencies. This new consumer credit-scoring model is used by 10% of the market, and 6 of the 10 largest banks use VantageScore.
Modern Credit
The Information Age has enabled a new era in consumer credit and assessing risk – and today, credit reports are used to inform decisions about housing, employment, insurance, and the cost of utilities. Learn more about how data, the internet, and modern computing is changing credit in Part 2 of this series.
on Last year, stock and bond returns tumbled after the Federal Reserve hiked interest rates at the fastest speed in 40 years. It was the first time in decades that both asset classes posted negative annual investment returns in tandem. Over four decades, this has happened 2.4% of the time across any 12-month rolling period. To look at how various stock and bond asset allocations have performed over history—and their broader correlations—the above graphic charts their best, worst, and average returns, using data from Vanguard.
How Has Asset Allocation Impacted Returns?
Based on data between 1926 and 2019, the table below looks at the spectrum of market returns of different asset allocations:
We can see that a portfolio made entirely of stocks returned 10.3% on average, the highest across all asset allocations. Of course, this came with wider return variance, hitting an annual low of -43% and a high of 54%.
A traditional 60/40 portfolio—which has lost its luster in recent years as low interest rates have led to lower bond returns—saw an average historical return of 8.8%. As interest rates have climbed in recent years, this may widen its appeal once again as bond returns may rise.
Meanwhile, a 100% bond portfolio averaged 5.3% in annual returns over the period. Bonds typically serve as a hedge against portfolio losses thanks to their typically negative historical correlation to stocks.
A Closer Look at Historical Correlations
To understand how 2022 was an outlier in terms of asset correlations we can look at the graphic below:
The last time stocks and bonds moved together in a negative direction was in 1969. At the time, inflation was accelerating and the Fed was hiking interest rates to cool rising costs. In fact, historically, when inflation surges, stocks and bonds have often moved in similar directions. Underscoring this divergence is real interest rate volatility. When real interest rates are a driving force in the market, as we have seen in the last year, it hurts both stock and bond returns. This is because higher interest rates can reduce the future cash flows of these investments. Adding another layer is the level of risk appetite among investors. When the economic outlook is uncertain and interest rate volatility is high, investors are more likely to take risk off their portfolios and demand higher returns for taking on higher risk. This can push down equity and bond prices. On the other hand, if the economic outlook is positive, investors may be willing to take on more risk, in turn potentially boosting equity prices.
Current Investment Returns in Context
Today, financial markets are seeing sharp swings as the ripple effects of higher interest rates are sinking in. For investors, historical data provides insight on long-term asset allocation trends. Over the last century, cycles of high interest rates have come and gone. Both equity and bond investment returns have been resilient for investors who stay the course.