Fast forward 60+ years, and the country now depends on foreign sources for 20 such materials, including ones essential for military and battery technologies. This puts the U.S. in a precarious position, depending largely on China and other foreign nations for the crucial materials such as lithium, cobalt, and rare earth metals that can help build and secure a more sustainable future.
America’s Energy Dependence
Today’s visualization comes from Standard Lithium, and it outlines China’s dominance of the critical minerals needed for the new energy era. Which imported minerals create the most risk for U.S. supply chains and national security?
Natural Resources and Development
Gaining access to natural resources can influence a nation’s ability to grow and defend itself. China’s growth strategy took this into account, and the country sourced massive amounts of raw materials to position the country as the number one producer and consumer of commodities. By the end of the second Sino-Japanese War in 1945, China’s mining industry was largely in ruins. After the war, vast amounts of raw materials were required to rebuild the country. In the late 1970s, the industry was boosted by China’s “reform and opening” policies, and since then, China’s mining outputs have increased enormously. China’s mining and material industries fueled the rapid growth of China from the 1980s onwards.
Supply Chain Dominance
A large number of Chinese mining companies also invest in overseas mining projects. China’s “going out” strategy encourages companies to move into overseas markets. They have several reasons to mine beyond its shores: to secure mineral resources that are scarce in China, to gain access to global markets and mineral supply chains, and to minimize domestic overproduction of some mineral commodities. This has led to China to become the leading producer of many of the world’s most important metals while also securing a commanding position in key supply chains. As an example of this, China is the world’s largest producer and consumer of rare earth materials. The country produces approximately 94% of the rare earth oxides and around 100% of the rare earth metals consumed globally, with 50% going to domestic consumption.
U.S.-China Trade Tensions
The U.S. drafted a list of 35 critical minerals in 2018 that are vital to national security, and according to the USGS, the country sources at least 31 of the materials chiefly through imports. China is the third largest supplier of natural resources to the U.S. behind Canada and Mexico. This dependence on China poses a risk. In 2010, a territorial dispute between China and Japan threatened to disrupt the supply of the rare earth elements. Today, a similar threat still looms over trade tensions between the U.S. and China. China’s scale of influence over critical minerals means that it could artificially limit supply and move prices in the global clean energy trade, in the same way that OPEC does with oil. This would leave nations that import their mineral needs in an expensive and potentially limiting spot.
Moon Shot: Building Domestic Supply and Production
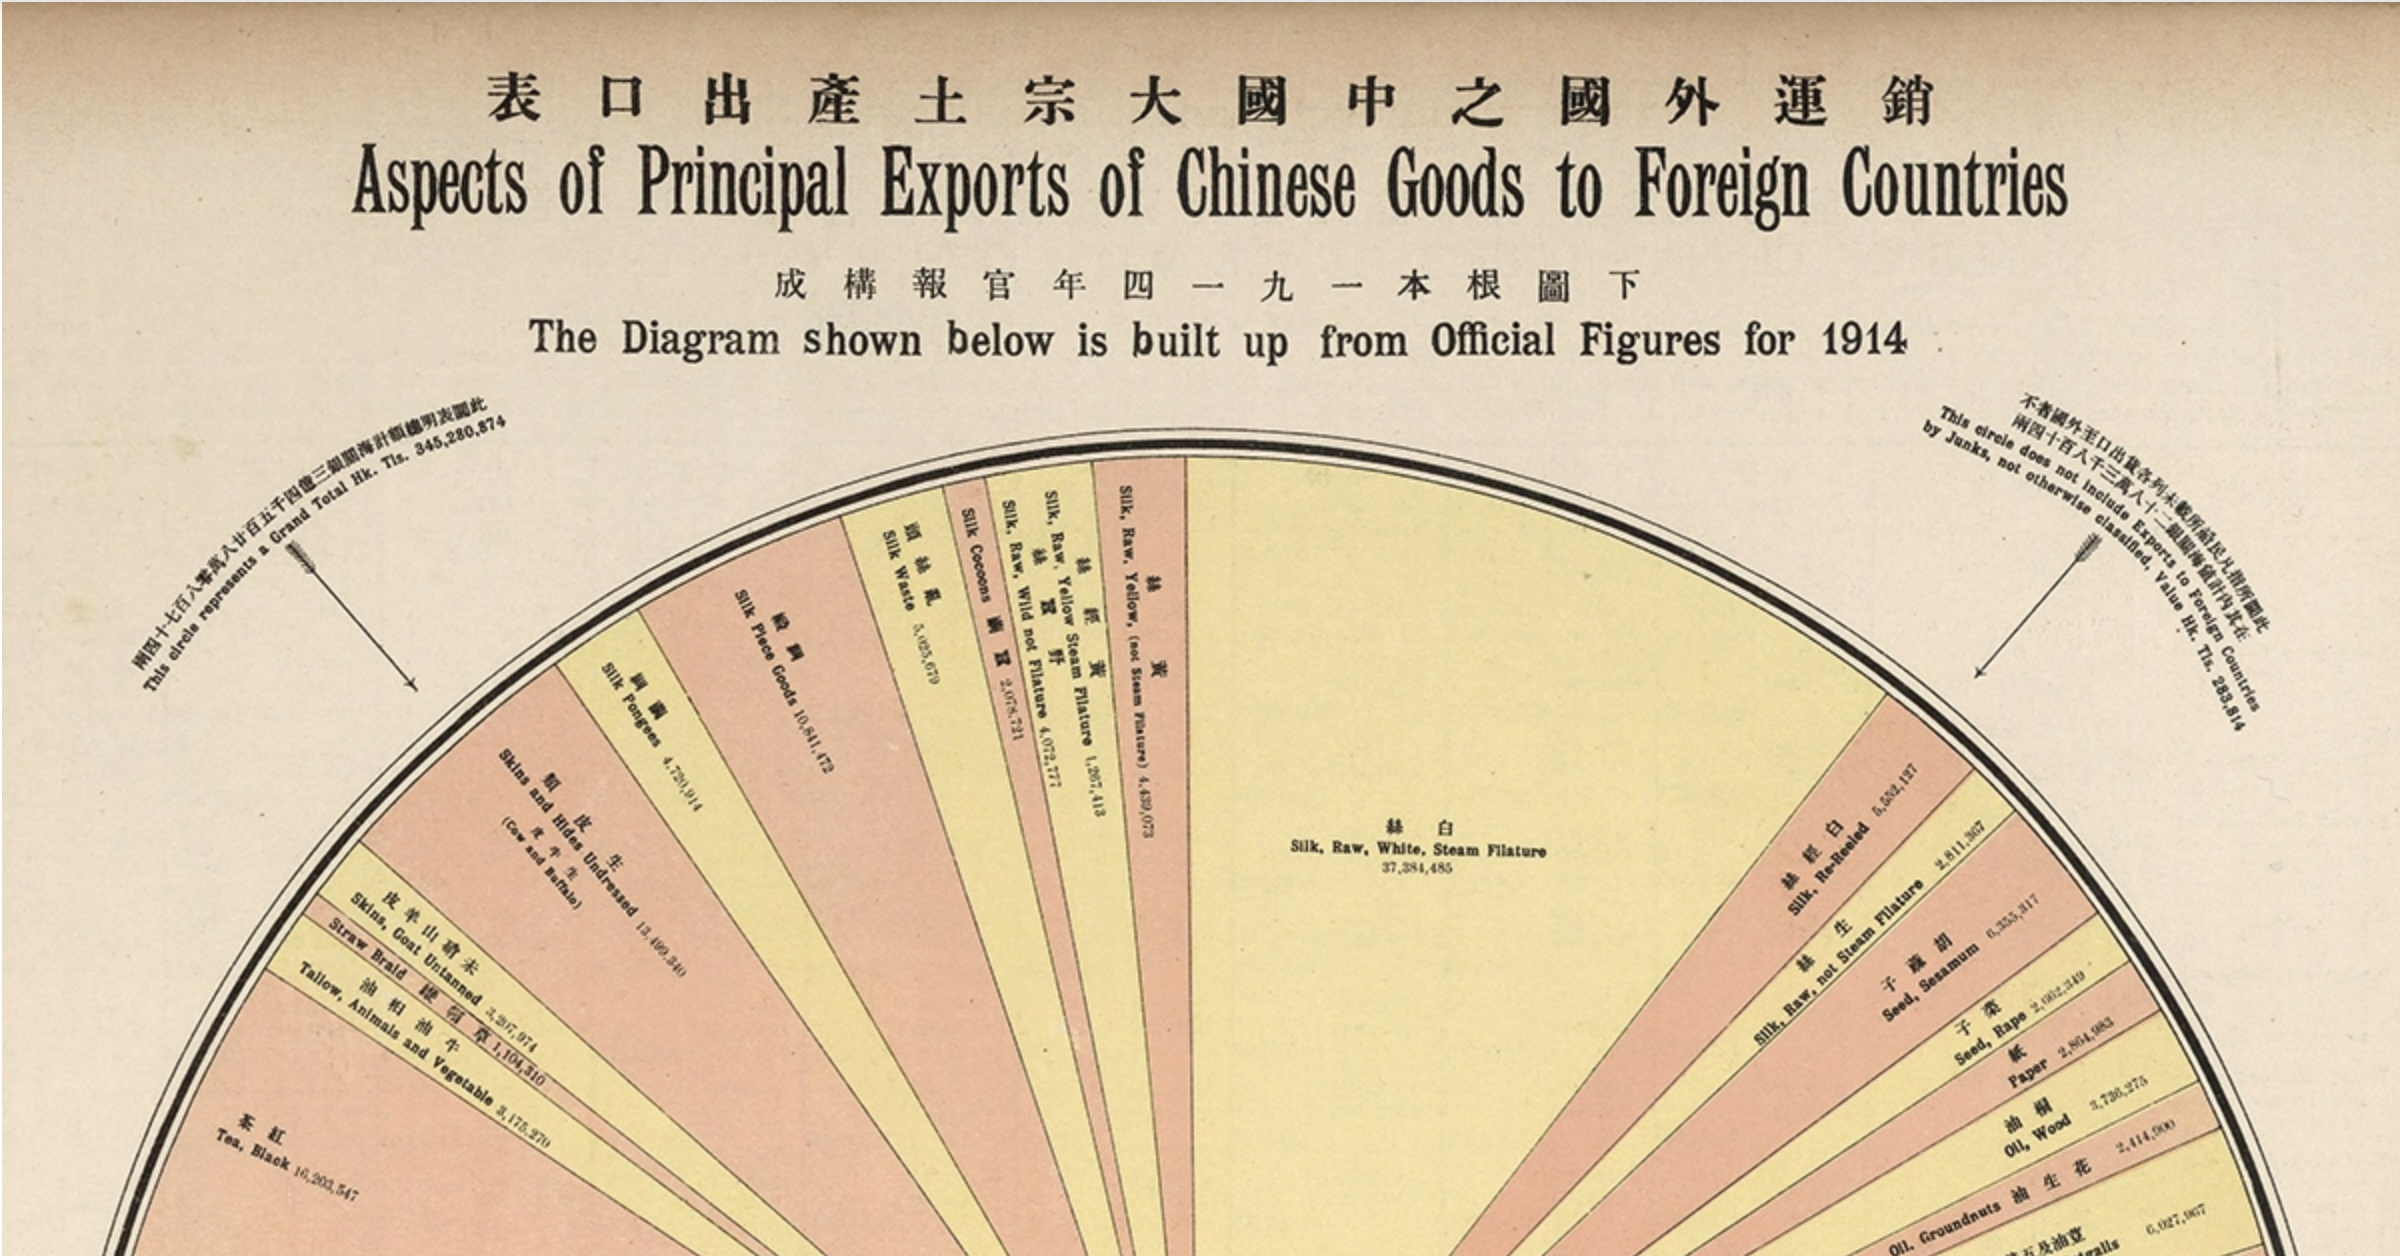
Every supply chain starts with raw materials. The U.S. had the world’s largest lithium industry until the 1990s—but this is no longer the case, even though the resources are still there. The U.S. holds 12% of the world’s identified lithium resources, but only produces 2% of global production from a single mine in Nevada. There are a handful of companies looking to develop the U.S. lithium reserves, but there is potential for so much more. Less than 18% of the U.S. land mass is geologically mapped at a scale suited to identifying new mineral deposits. The United States has the resources, it is just a question of motivation. Developing domestic resources can reduce its foreign dependence, and enable it to secure the new energy era. —Scientific American on A statement that is as profound as it is banal. In other words, when we do history, we’re a bit like tourists. If we really want to understand the past, we have to think like a local. The infographic above, Aspects of Principal Exports of Chinese Goods to Foreign Countries, is the first in a series that we’re calling Vintage Viz, which presents a historical visualization along with the background and analytical tools to make sense of it. Today, the People’s Republic of China is the second largest economy in the world, a permanent member of the UN Security Council, and a growing military power. But at the dawn of the 20th century, things were much, much different.
Opium and the Opening of China to the West
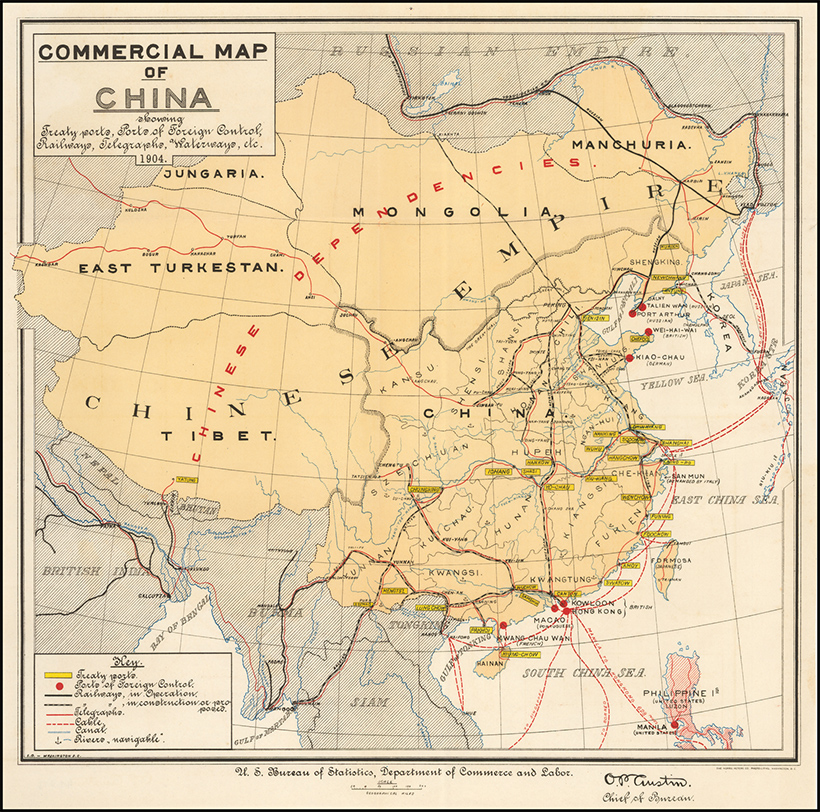
Early Sino-Western trade was restricted by the Qing emperors to three ports, and after 1757, just one, in what became known as the Canton System. This name came from the one remaining port city of the same name, present-day Guangzhou. Foreign trade was tightly monitored and subject to stiff tariffs, and Western traders chafed under these restrictions. So when in 1839, Chinese authorities moved to shut down opium smuggling—an important source of profit for foreign merchants—Western powers saw their chance and used the pretext to revise the terms of trade by force. In what became known as the Opium Wars, 1839-1842 and 1856-1860, first Great Britain and then an Anglo-French alliance defeated imperial China and imposed punitive treaties that included indemnities and lowered tariffs, but also expanded the number of ports open to foreign traders, first to five and by 1911, to more than 50.
Westerners were exempted from local laws, Christian missionaries were allowed to proselytize freely, and the opium trade was legalized. Hong Kong was also ceded to Great Britain at this time. The Treaty Port Era, also known as the Century of Humiliation, was perhaps too much for the country to bear. The weakened central government was beset by popular unrest, including the Taiping Rebellion (1850–64), which killed 20 million people, and the Boxer Rebellion (1899-1901), so-named for the secret society that led the movement, the Righteous and Harmonious Fists. Eventually, the last Chinese emperor was deposed and a republic declared in 1911. Nevertheless, the government was too weak to impose its will, and was repeatedly challenged by warlords. So as we approach the outbreak of the First World War in 1914, and the period covered by our visualization, we find China weakened internally by civil strife, and externally by Western powers.
The History of this Century-Old Pie Chart
Aspects of Principal Exports of Chinese Goods to Foreign Countries captures Chinese exports for 1914, and comes from The New Atlas and Commercial Gazetteer of China: A Work Devoted to Its Geography & Resources and Economic & Commercial Development. Originally published in 1917 and edited by Edwin J. Dingle for the Far Eastern Geographical Establishment, the volume contains a wealth of data for the period. According to the book’s Preface, it “seeks to give all the information that is essential to the business-man in regard to a country… about which less is known than in regard to any similar area in the world.” The visualization breaks down total Chinese exports for 1914 in haikwan taels (hk. tls.), a unit of silver currency used to collect tariffs. In 1907, one haikwan tael was worth $0.79 U.S. dollars. Official figures come from the Chinese Maritime Customs Service. This was set up by foreign consuls after the First Opium War to collect tariffs to guarantee the payment of treaty indemnities. Exports in 1914 represented 345 million hk. tls., a 14.4% decrease from 1913, likely owing to the outbreak of the First World War that same year. Apart from “Other Metals and Minerals, Sundries, etc,” which served as a catch-all category, the largest categories were silks and teas of various types, representing 22.6% and 10.4% of total exports respectively. Below are some more details that emerge from this visualization.
All the Tea in China
The Chinese tea trade was the subject of another visualization in the Atlas. It shows that China had been steadily losing ground to British India. Between 1888-1892 Chinese exports to Great Britain were 242 million pounds against India’s 105 million pounds. By 1912-1913, India had surpassed China to export 279 million pounds against 198 million pounds. In 1914, the majority of Chinese exports went to Russia, 902,716 piculs in all. A picul is equal to “as much as a man can carry on a shoulder-pole” or about 133 pounds.
The Silk Road to Profits
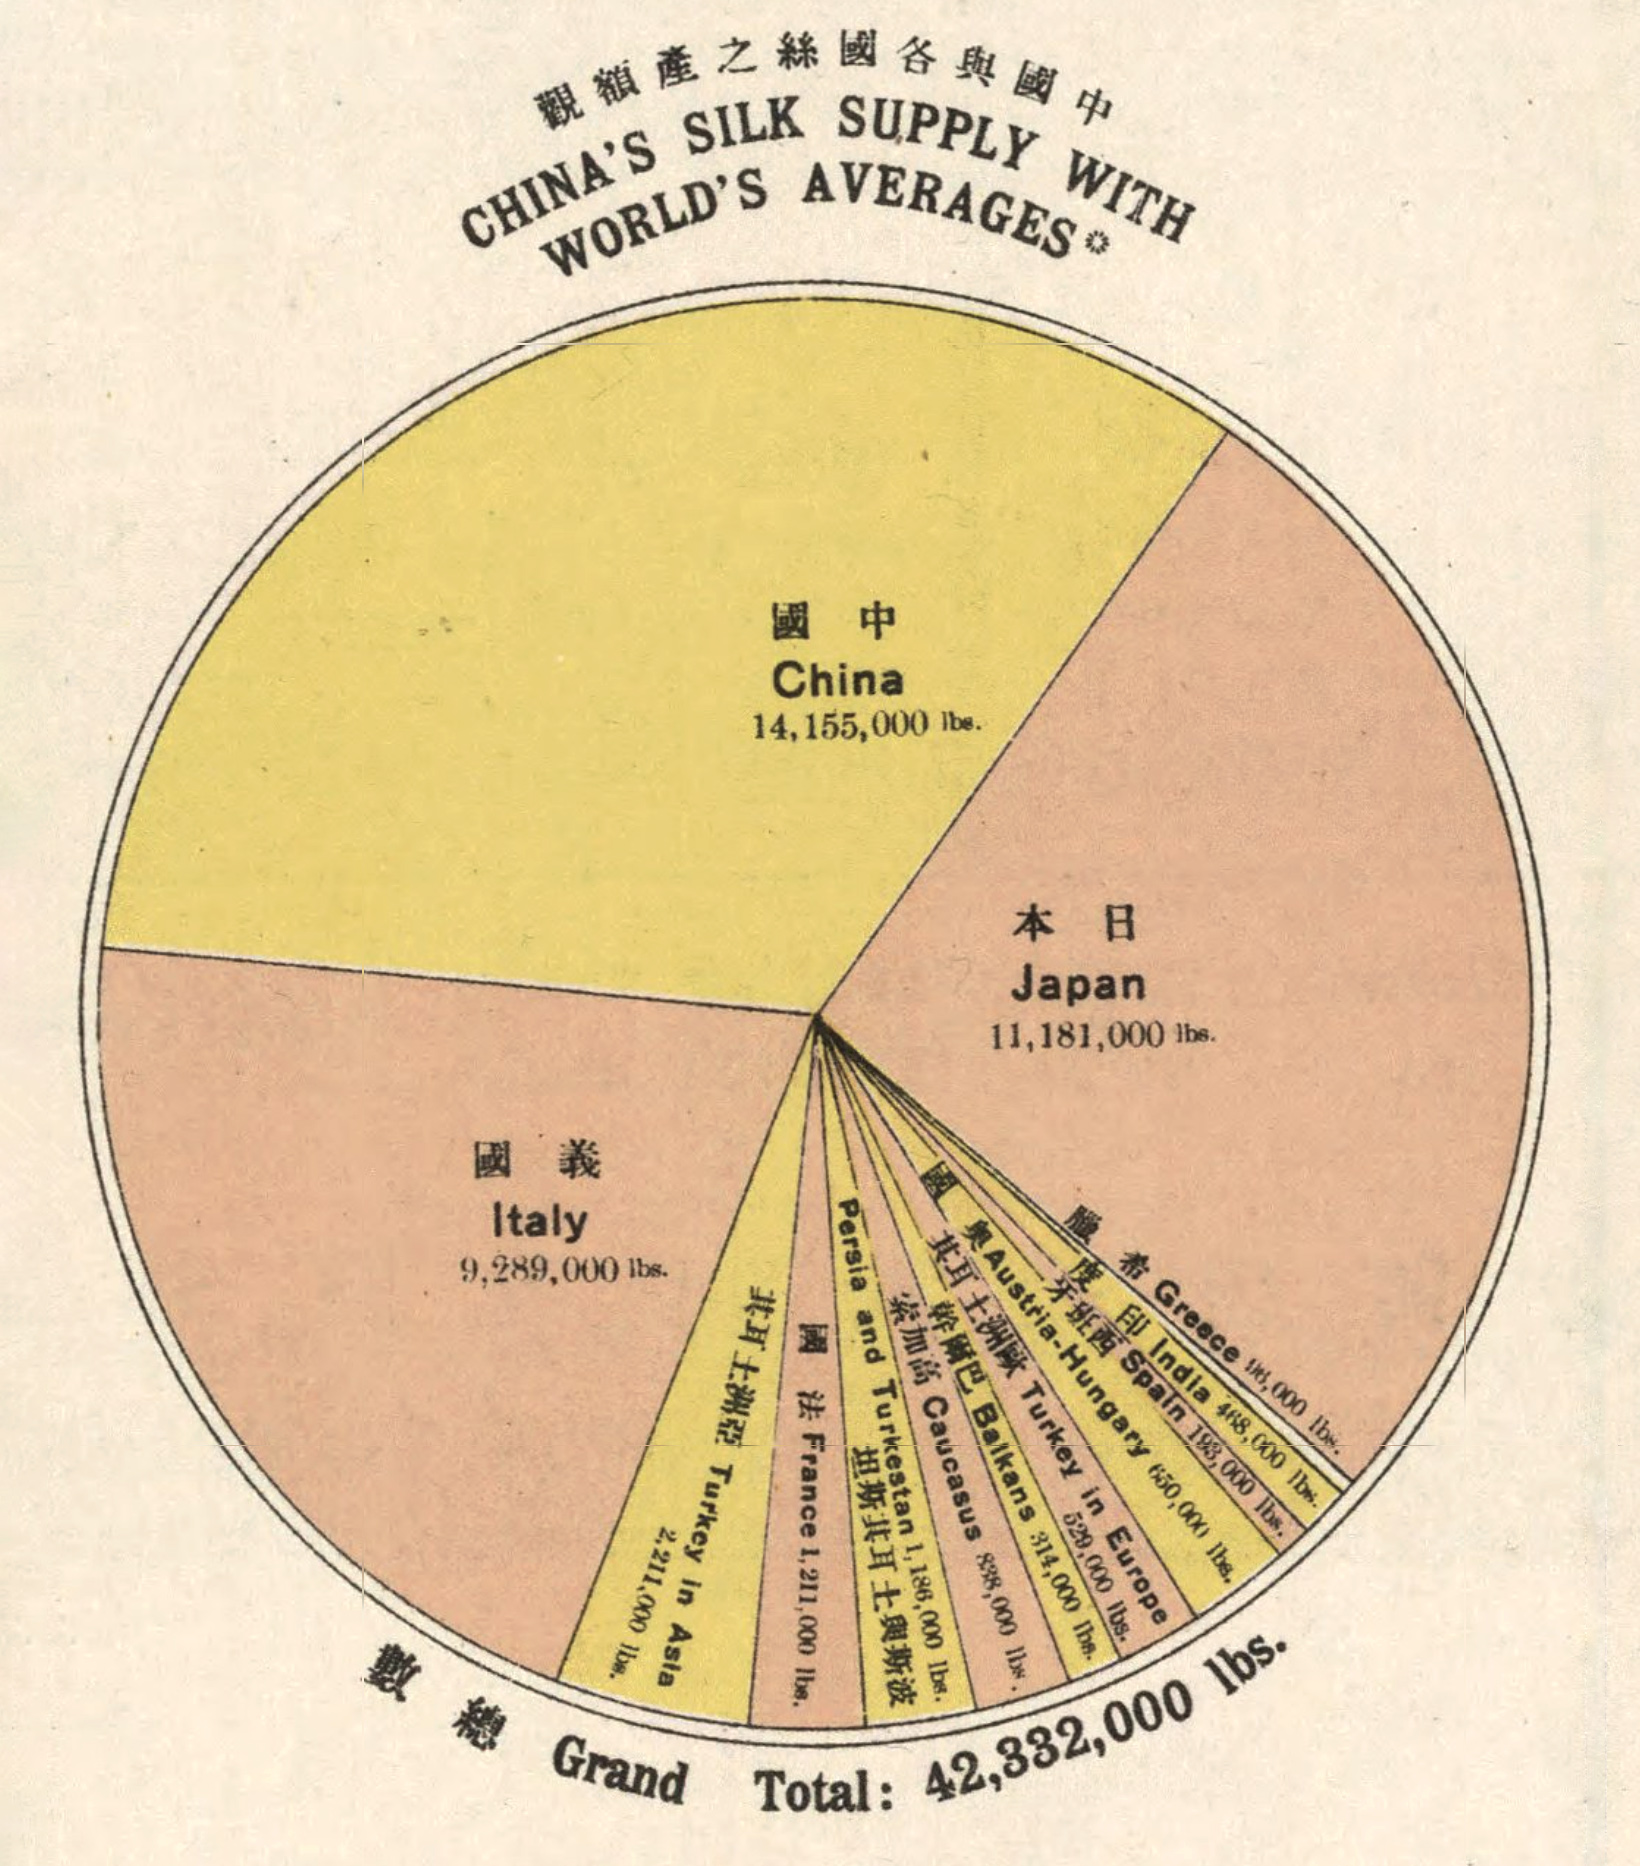
Silk has long been in demand in the West as a luxury good, giving its name to the overland trade route that connected East and West for centuries: the Silk Road. In 1914, China was the largest producer and exporter of silks in the world. On an annual basis, China averaged 14 million pounds, compared to the number two spot, Japan, at 11 million pounds, and number three, Italy, at 9 million pounds. Together, these three controlled 81.7% of the global silk trade.
The Opium of the Masses?
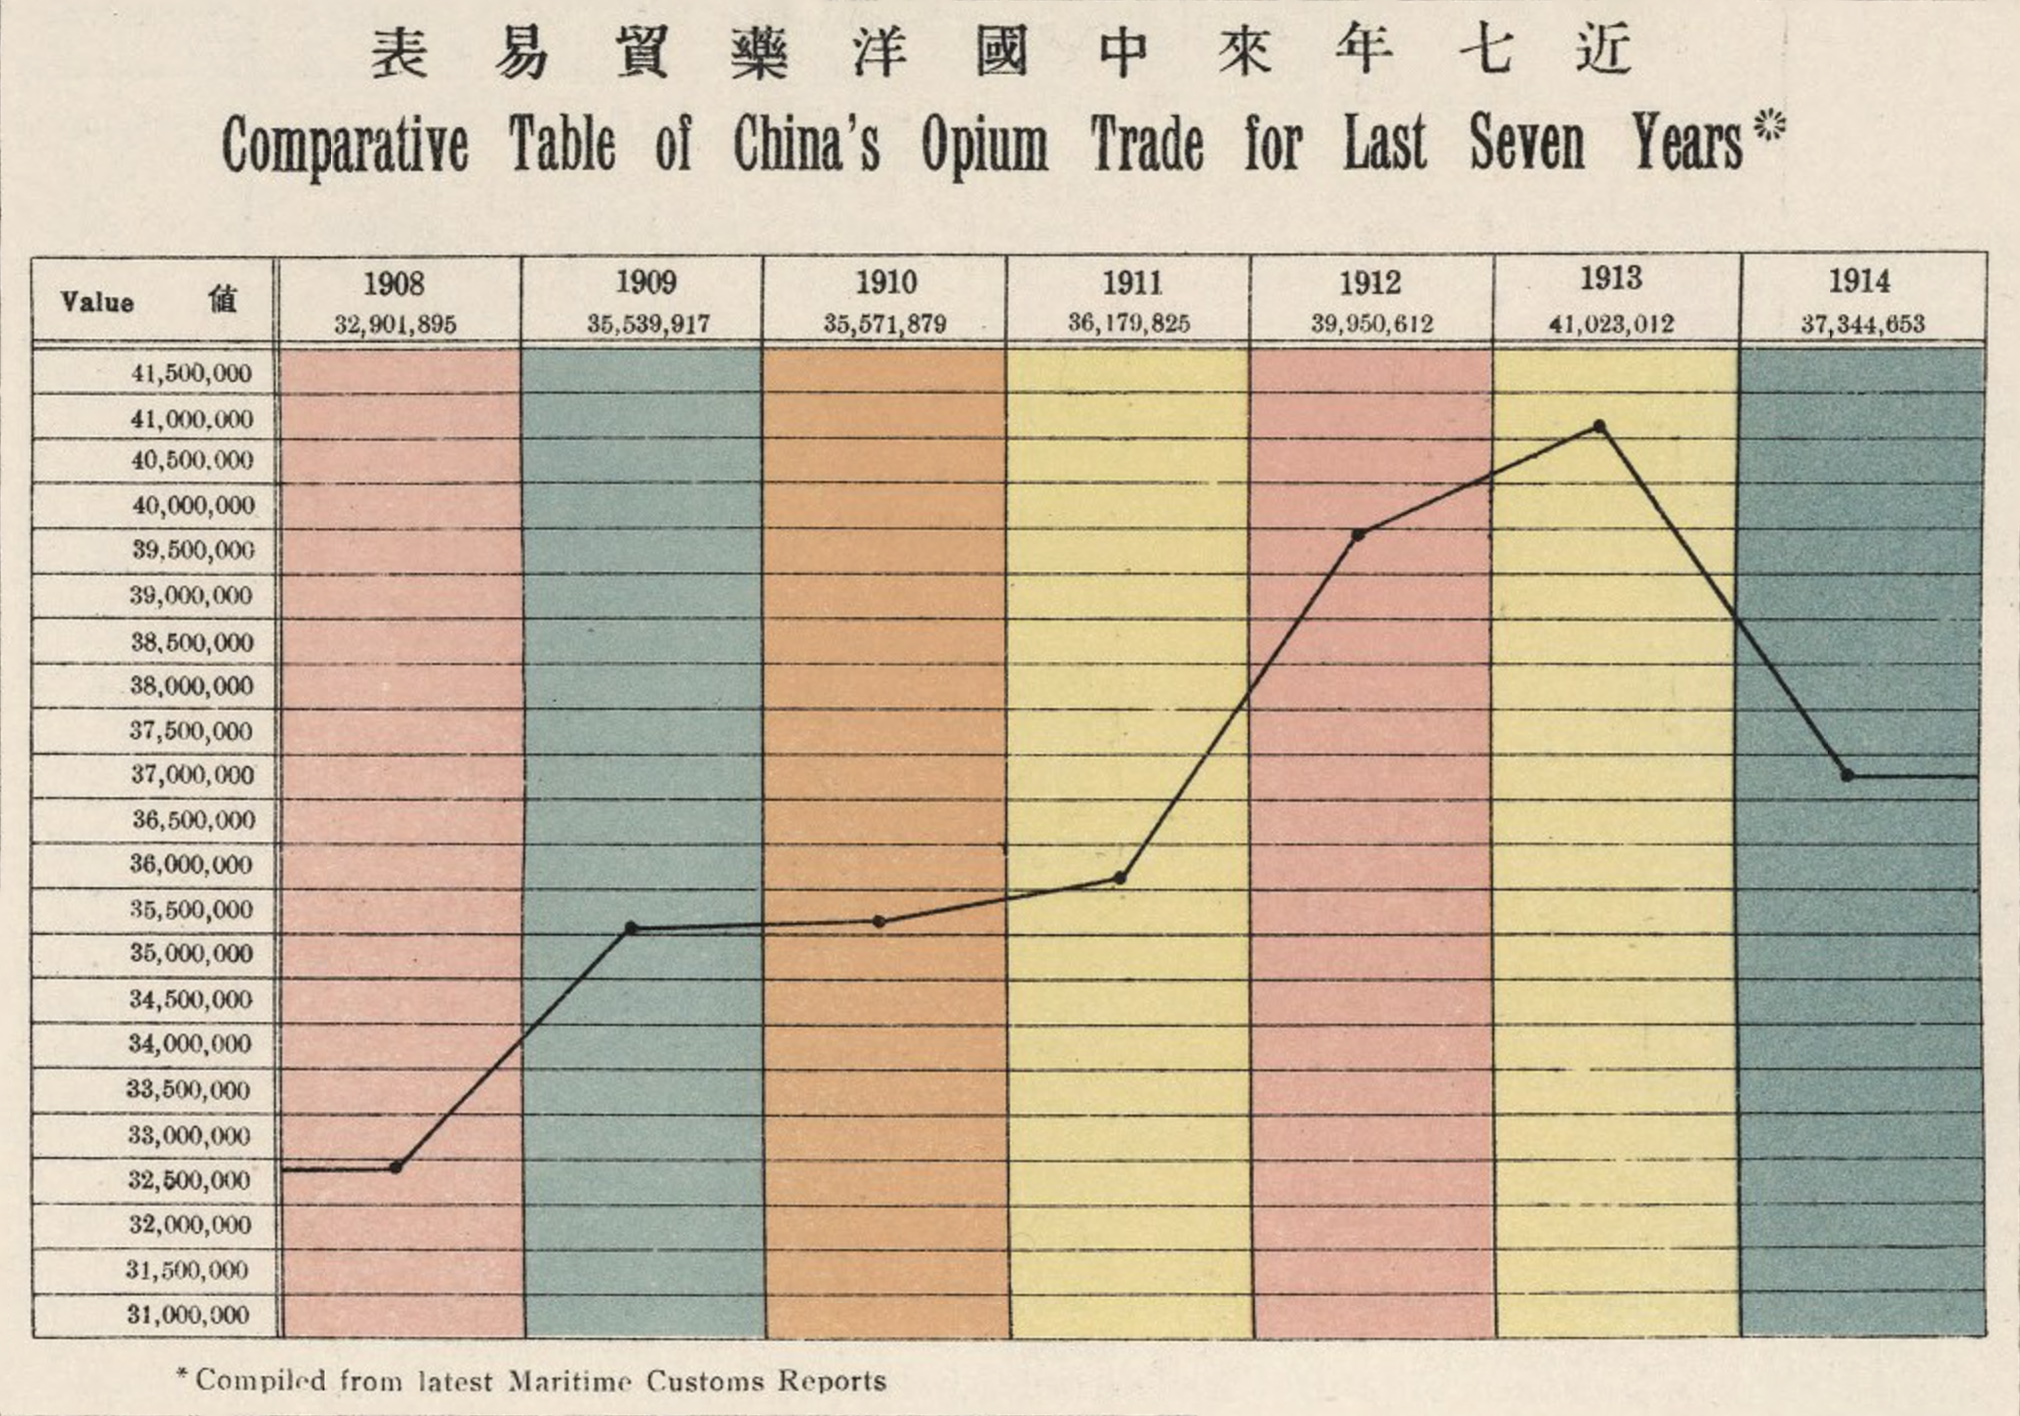
The opium trade, the pretext that opened China to foreign trade, was still big money in 1914. A total of 37 million hk. tls. were imported in 1914 from India, up 11.9% from 1908. This is actually down from a peak of 41 million hk. tls. in 1913.
In 1907, China signed the Ten Year Agreement with India, which ultimately phased out the opium trade. By 1917 the trade was all but extinguished.
Back to the Future
The Aspects of Principal Exports of Chinese Goods to Foreign Countries is a far cry from the contemporary trade picture. China’s top export in 2021 was in the category “telephones for cellular networks or other wireless networks,” and was worth $147.1 billion. But it’s worth noting that China today is a direct result of this period. The resentment created during the Century of Humiliation would eventually help lead to Mao Zedong, the Long March, and the establishment of the People’s Republic of China. And in 1979, the Chinese central government would set up the first of their own “treaty ports,” in the form of special economic zones, places where foreign companies could set up shop. But this time, it wasn’t foreign powers who were making the rules.