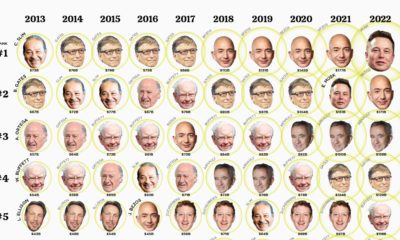
If you look at any ranking of the world’s richest people, you will notice that most of the names derive their wealth from building individual, successful companies. Warren Buffett, who appears third on such a list, is completely unique in this sense. Through his holding company Berkshire Hathaway, he has bought, sold, or invested in hundreds of companies over the years, and their industries are all over the map. These investments include consumer goods companies like Coca-Cola, daily national newspapers like The Washington Post, and insurance companies like GEICO. Buffett currently owns 36.8% of Berkshire – and at the time of publishing, Berkshire Hathaway is worth an impressive $480 billion, employing 377,000 people across many different industries.
Origin Story
Although Berkshire Hathaway is today associated with Buffett and his long-time partner Charlie Munger, the origins of the company actually stem from 1839. The original company was a textile mill in Rhode Island, and by 1948 Berkshire employed 11,000 people and brought in $29.5 million in revenue (about $300 million in today’s dollars). After Berkshire’s stock began to decline in the late 1950s, Buffett saw value in the company and started accumulating shares. By 1964, Buffett wanted out, and the company’s CEO Seabury Stanton tendered an offer to buy Buffett’s shares for $11.37, which was $0.13 less than he had promised. This made Buffett mad, and instead of taking the offer, he opted to buy more shares. Eventually he took control of the company and fired Stanton. The company was his, and the rest is history.
The Scoreboard
In the long-running contest of Warren Buffett vs. the market, the scoreboard isn’t even close:
If you’re wondering how Warren Buffett developed such an impressive investing record, it’s worth seeing Part 2 of this series: Inside Buffett’s Brain.
Revenue by Business Segments
The Warren Buffett Empire is diverse, and made up of hundreds of companies in different industries. However, segmenting by revenue does give an idea of how Berkshire makes its money:
The Berkshire Portfolio
Berkshire Hathaway’s portfolio can be broken down into two categories: the companies it owns outright (or majority stakes in), and the companies it owns significant investments in. Companies Owned by Berkshire Berkshire Hathaway owns well-known brands ranging from Dairy Queen to Duracell. Here are all those companies listed by number of employees: Importantly, you’ll notice that there are only 26 employees in Berkshire Hathaway’s corporate office – that’s because Buffett is adamant that portfolio companies need to be well-managed in their own right, and he thinks this decentralization is a key to his success. Investments Here are the companies Berkshire Hathaway has significant investments in – the whole portfolio is worth nearly $200 billion: The portfolio is pretty much a microcosm of the American economy: it features banks, airlines, consumer goods companies, and even tech behemoths like Apple. Other Brands Lastly, it’s worth noting that Buffett doesn’t stop there – his company also owns 80 auto dealerships, the second-largest real estate broker in the country (HomeServices of America), and even 32 daily newspapers.
Deals that Made the Empire
The Warren Buffett Empire wouldn’t exist without Buffett being involved in some of most famous deals in business history. Below are some of the big names Buffett has been involved with. ABC Buffett helped finance the Capital Cities takeover of ABC – at the time, the largest non-oil merger in history. Eventually, CapCities/ABC was sold to Disney. ESPN Before ESPN was the household name it is today, Buffett owned a big chunk of it as an upstart sports brand in 1985, as a part of the CapCities/ABC deal. Heinz Berkshire Hathaway and 3G Capital led a takeover of Heinz in 2013. This gave Buffett control of trusted brands like HP Sauce, Lea & Perrins, as well as the namesake brand. Washington Post Buffett delivered the newspaper as a kid, but later in his life would be the largest outside shareholder of the famous paper. Salomon Brothers Buffett helped lead a desperate shakeup at one of Wall Street’s most famous investment banks. USAir After almost losing all the $358 million he had invested, Buffett called buying preferred shares in the airline one of his biggest mistakes. Gillette Buffett started buying shares in the last 1980s, and became Gillette’s biggest shareholder. Buffett made $4.4 billion in paper profit when it sold the company to Proctor & Gamble. on Last year, stock and bond returns tumbled after the Federal Reserve hiked interest rates at the fastest speed in 40 years. It was the first time in decades that both asset classes posted negative annual investment returns in tandem. Over four decades, this has happened 2.4% of the time across any 12-month rolling period. To look at how various stock and bond asset allocations have performed over history—and their broader correlations—the above graphic charts their best, worst, and average returns, using data from Vanguard.
How Has Asset Allocation Impacted Returns?
Based on data between 1926 and 2019, the table below looks at the spectrum of market returns of different asset allocations:
We can see that a portfolio made entirely of stocks returned 10.3% on average, the highest across all asset allocations. Of course, this came with wider return variance, hitting an annual low of -43% and a high of 54%.
A traditional 60/40 portfolio—which has lost its luster in recent years as low interest rates have led to lower bond returns—saw an average historical return of 8.8%. As interest rates have climbed in recent years, this may widen its appeal once again as bond returns may rise.
Meanwhile, a 100% bond portfolio averaged 5.3% in annual returns over the period. Bonds typically serve as a hedge against portfolio losses thanks to their typically negative historical correlation to stocks.
A Closer Look at Historical Correlations
To understand how 2022 was an outlier in terms of asset correlations we can look at the graphic below:
The last time stocks and bonds moved together in a negative direction was in 1969. At the time, inflation was accelerating and the Fed was hiking interest rates to cool rising costs. In fact, historically, when inflation surges, stocks and bonds have often moved in similar directions. Underscoring this divergence is real interest rate volatility. When real interest rates are a driving force in the market, as we have seen in the last year, it hurts both stock and bond returns. This is because higher interest rates can reduce the future cash flows of these investments. Adding another layer is the level of risk appetite among investors. When the economic outlook is uncertain and interest rate volatility is high, investors are more likely to take risk off their portfolios and demand higher returns for taking on higher risk. This can push down equity and bond prices. On the other hand, if the economic outlook is positive, investors may be willing to take on more risk, in turn potentially boosting equity prices.
Current Investment Returns in Context
Today, financial markets are seeing sharp swings as the ripple effects of higher interest rates are sinking in. For investors, historical data provides insight on long-term asset allocation trends. Over the last century, cycles of high interest rates have come and gone. Both equity and bond investment returns have been resilient for investors who stay the course.