Everything connected to the internet takes bandwidth to view. When you look at something on your smartphone—whether it’s a new message on Instagram or the next few seconds of a YouTube video—your device is downloading the data in the background. And the bigger the files, the more bandwidth is utilized. In this chart, we break down of the most used apps by category, using Sandvine’s global mobile traffic report for 2021 Q1.
Video Drives Global Mobile Internet Traffic
The biggest files use the most data, and video files take the cake. According to Android Central, streaming video ranges from about 0.7GB per hour of data for a 480p video to 1.5GB per hour for 1080. A 4K stream, the highest resolution currently offered by most providers, uses around 7.2GB per hour. That’s miles bigger than audio files, where high quality 320kbps music streams use an average of just 0.12GB per hour. Social network messages are usually just a few KB, while the pictures found on them can range from a few hundred KB for a low resolution image to hundreds of MB for high resolution. Understandably, breaking down mobile downstream traffic by app category shows that video is on top by a long shot: Video streaming accounts for almost half of mobile downstream traffic worldwide at 49%. Audio streaming, including music and podcasts, accounts for just 0.2%. Comparatively, social network and web browsing combined make up one third of downstream internet traffic. Games, marketplace apps, and file sharing, despite their large file sizes, only require one-time downloads that don’t put as big of a strain on traffic as video does.
A Handful of Companies Own the Most Used Apps
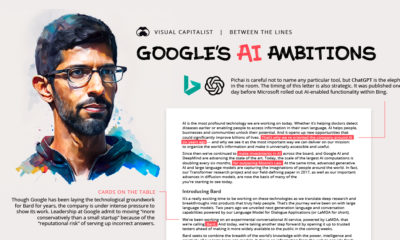
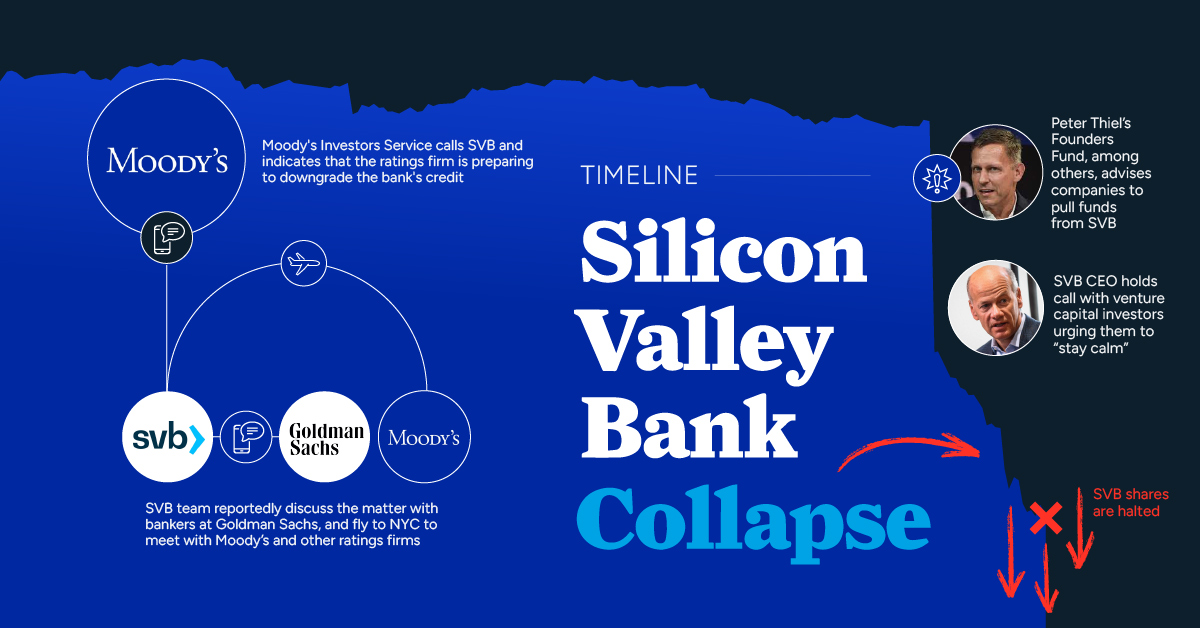
Though internet traffic data is broken down by category, it’s worth noting that many apps consume multiple types of bandwidth. For example, messaging and social network apps, like WhatsApp, Instagram, and Snapchat, allow consumers to stream video, social network, and message. Even marketplace apps like iTunes and Google Play consume bandwidth for video and audio streaming, and together account for 6.3% of total mobile downstream traffic. But no single app had a bigger footprint than YouTube, which accounts for 20.4% of total global downstream bandwidth. The world’s tech giants had the leading app in the four biggest data streaming categories. Alphabet’s YouTube and Google made up almost half of all video streaming and web browsing traffic, while Facebook’s own app, combined with Instagram and WhatsApp, accounted for 93% of global social networking traffic and 45% of messaging traffic. Traffic usage by app highlights the data monopoly of tech giants and internet providers. Since just a few companies account for a majority of global smartphone internet traffic, they have a lot more bartering power (and responsibility) when it comes to our general internet consumption. on But fast forward to the end of last week, and SVB was shuttered by regulators after a panic-induced bank run. So, how exactly did this happen? We dig in below.
Road to a Bank Run
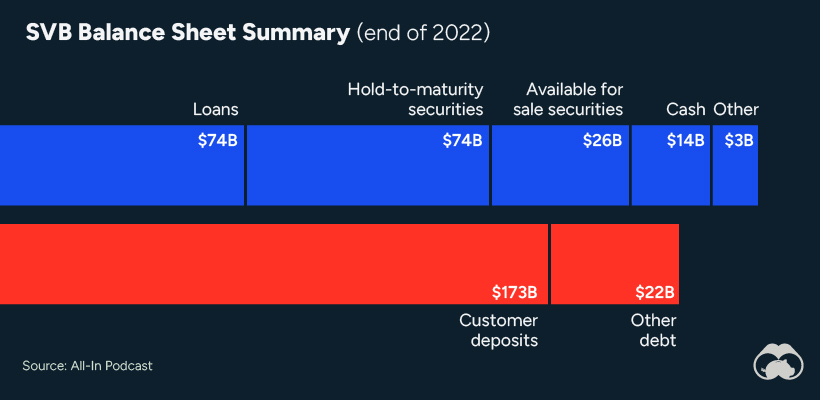
SVB and its customers generally thrived during the low interest rate era, but as rates rose, SVB found itself more exposed to risk than a typical bank. Even so, at the end of 2022, the bank’s balance sheet showed no cause for alarm.
As well, the bank was viewed positively in a number of places. Most Wall Street analyst ratings were overwhelmingly positive on the bank’s stock, and Forbes had just added the bank to its Financial All-Stars list. Outward signs of trouble emerged on Wednesday, March 8th, when SVB surprised investors with news that the bank needed to raise more than $2 billion to shore up its balance sheet. The reaction from prominent venture capitalists was not positive, with Coatue Management, Union Square Ventures, and Peter Thiel’s Founders Fund moving to limit exposure to the 40-year-old bank. The influence of these firms is believed to have added fuel to the fire, and a bank run ensued. Also influencing decision making was the fact that SVB had the highest percentage of uninsured domestic deposits of all big banks. These totaled nearly $152 billion, or about 97% of all deposits. By the end of the day, customers had tried to withdraw $42 billion in deposits.
What Triggered the SVB Collapse?
While the collapse of SVB took place over the course of 44 hours, its roots trace back to the early pandemic years. In 2021, U.S. venture capital-backed companies raised a record $330 billion—double the amount seen in 2020. At the time, interest rates were at rock-bottom levels to help buoy the economy. Matt Levine sums up the situation well: “When interest rates are low everywhere, a dollar in 20 years is about as good as a dollar today, so a startup whose business model is “we will lose money for a decade building artificial intelligence, and then rake in lots of money in the far future” sounds pretty good. When interest rates are higher, a dollar today is better than a dollar tomorrow, so investors want cash flows. When interest rates were low for a long time, and suddenly become high, all the money that was rushing to your customers is suddenly cut off.” Source: Pitchbook Why is this important? During this time, SVB received billions of dollars from these venture-backed clients. In one year alone, their deposits increased 100%. They took these funds and invested them in longer-term bonds. As a result, this created a dangerous trap as the company expected rates would remain low. During this time, SVB invested in bonds at the top of the market. As interest rates rose higher and bond prices declined, SVB started taking major losses on their long-term bond holdings.
Losses Fueling a Liquidity Crunch
When SVB reported its fourth quarter results in early 2023, Moody’s Investor Service, a credit rating agency took notice. In early March, it said that SVB was at high risk for a downgrade due to its significant unrealized losses. In response, SVB looked to sell $2 billion of its investments at a loss to help boost liquidity for its struggling balance sheet. Soon, more hedge funds and venture investors realized SVB could be on thin ice. Depositors withdrew funds in droves, spurring a liquidity squeeze and prompting California regulators and the FDIC to step in and shut down the bank.
What Happens Now?
While much of SVB’s activity was focused on the tech sector, the bank’s shocking collapse has rattled a financial sector that is already on edge.
The four biggest U.S. banks lost a combined $52 billion the day before the SVB collapse. On Friday, other banking stocks saw double-digit drops, including Signature Bank (-23%), First Republic (-15%), and Silvergate Capital (-11%).
Source: Morningstar Direct. *Represents March 9 data, trading halted on March 10.
When the dust settles, it’s hard to predict the ripple effects that will emerge from this dramatic event. For investors, the Secretary of the Treasury Janet Yellen announced confidence in the banking system remaining resilient, noting that regulators have the proper tools in response to the issue.
But others have seen trouble brewing as far back as 2020 (or earlier) when commercial banking assets were skyrocketing and banks were buying bonds when rates were low.