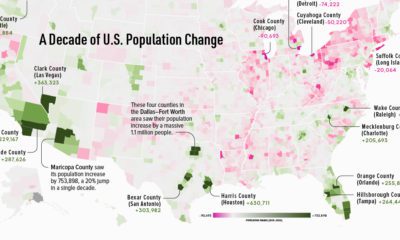
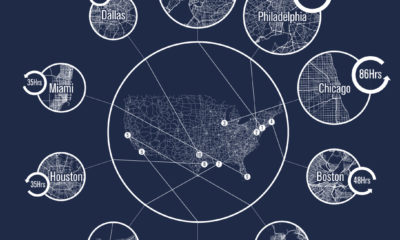
It’s no secret that cities like New York have a vastly different population density than, say, a rural county in North Dakota. Even so, this interactive map by Ben Blatt of Slate helps visualize the stark contrast between urban and rural densities in a way that might intrigue you. How many counties does it take to equal the population of these large urban areas? Let’s find out.
New York City’s Rural Equivalent
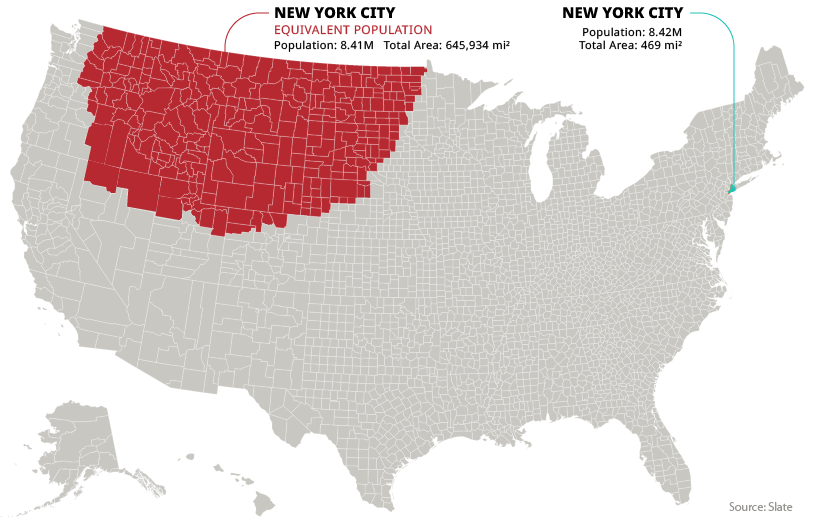
New York City (proper) Population: 8.42 million New York City Population density: 27,547 persons / mi² New York City became the largest city in the U.S. back in 1781 and has long been the country’s most densely packed urban center. Today, 1 in every 38 people living in the United States resides in The Big Apple.
For the northwestern counties above to match the population of New York City, it takes a land area around the size of Mongolia. The region shown above is 645,934 mi², and runs through portions of 12 different states. In order to match the population of the entire New York metropolitan area, which holds 18 million people and includes adjacent cities and towns in New York state, New Jersey, and Connecticut, the above equivalent area would have to be even more massive.
Los Angeles County’s Rural Equivalent
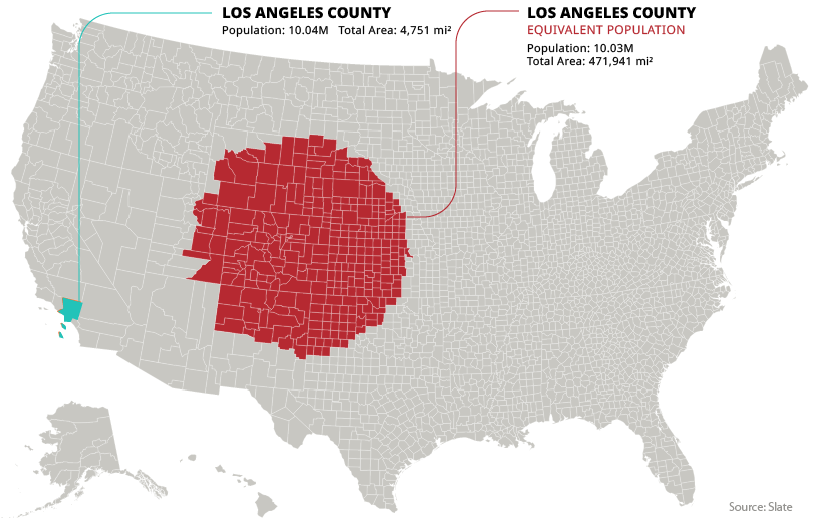
LA County Population: 10.04 million LA County Population density: 2,100 persons / mi² Los Angeles County is home to the 88 incorporated cities that make up the urban area of Los Angeles. Even excluding nearby population centers such as Anaheim, San Bernadino, and Riverside (which are located in adjacent counties) it is still the most populous county in the United States, with over 10 million inhabitants.
To match this enormous scale in Middle America, it would take 298 counties covering an area of 471,941 mi².
Chicago’s Rural Equivalent
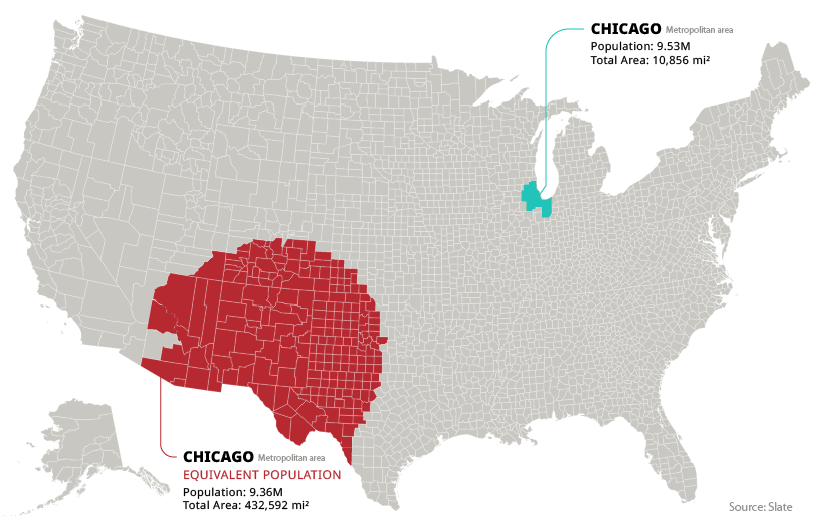
Chicago Metropolitan Area Population: 9.53 million Chicago Metropolitan Area Population density: 1,318 persons / mi² Next up is America’s third largest city, Chicago. For this visualization, we’re using the Chicago metropolitan area, which covers the full extent of the city’s population.
To match the scale of the population of the Windy City, we would need to add up every county in New Mexico, along with large portions of Colorado, Arizona, and Texas.
Turning the Tables?
Conversely, what if we transported the people in the country’s least densely populated counties into the middle of an urban center? As it turns out, the total population of the five least populated counties is just 1,394—roughly the same amount of people that live on the average Manhattan block. on Both figures surpassed analyst expectations by a wide margin, and in January, the unemployment rate hit a 53-year low of 3.4%. With the recent release of February’s numbers, unemployment is now reported at a slightly higher 3.6%. A low unemployment rate is a classic sign of a strong economy. However, as this visualization shows, unemployment often reaches a cyclical low point right before a recession materializes.
Reasons for the Trend
In an interview regarding the January jobs data, U.S. Treasury Secretary Janet Yellen made a bold statement: While there’s nothing wrong with this assessment, the trend we’ve highlighted suggests that Yellen may need to backtrack in the near future. So why do recessions tend to begin after unemployment bottoms out?
The Economic Cycle
The economic cycle refers to the economy’s natural tendency to fluctuate between periods of growth and recession. This can be thought of similarly to the four seasons in a year. An economy expands (spring), reaches a peak (summer), begins to contract (fall), then hits a trough (winter). With this in mind, it’s reasonable to assume that a cyclical low in the unemployment rate (peak employment) is simply a sign that the economy has reached a high point.
Monetary Policy
During periods of low unemployment, employers may have a harder time finding workers. This forces them to offer higher wages, which can contribute to inflation. For context, consider the labor shortage that emerged following the COVID-19 pandemic. We can see that U.S. wage growth (represented by a three-month moving average) has climbed substantially, and has held above 6% since March 2022. The Federal Reserve, whose mandate is to ensure price stability, will take measures to prevent inflation from climbing too far. In practice, this involves raising interest rates, which makes borrowing more expensive and dampens economic activity. Companies are less likely to expand, reducing investment and cutting jobs. Consumers, on the other hand, reduce the amount of large purchases they make. Because of these reactions, some believe that aggressive rate hikes by the Fed can either cause a recession, or make them worse. This is supported by recent research, which found that since 1950, central banks have been unable to slow inflation without a recession occurring shortly after.
Politicians Clash With Economists
The Fed has raised interest rates at an unprecedented pace since March 2022 to combat high inflation. More recently, Fed Chairman Jerome Powell warned that interest rates could be raised even higher than originally expected if inflation continues above target. Senator Elizabeth Warren expressed concern that this would cost Americans their jobs, and ultimately, cause a recession. Powell remains committed to bringing down inflation, but with the recent failures of Silicon Valley Bank and Signature Bank, some analysts believe there could be a pause coming in interest rate hikes. Editor’s note: just after publication of this article, it was confirmed that U.S. interest rates were hiked by 25 basis points (bps) by the Federal Reserve.