Recent data from the Bureau of Labor Statistics highlights rising costs across the board, and shows that specific sectors are experiencing rapid price increases this year.
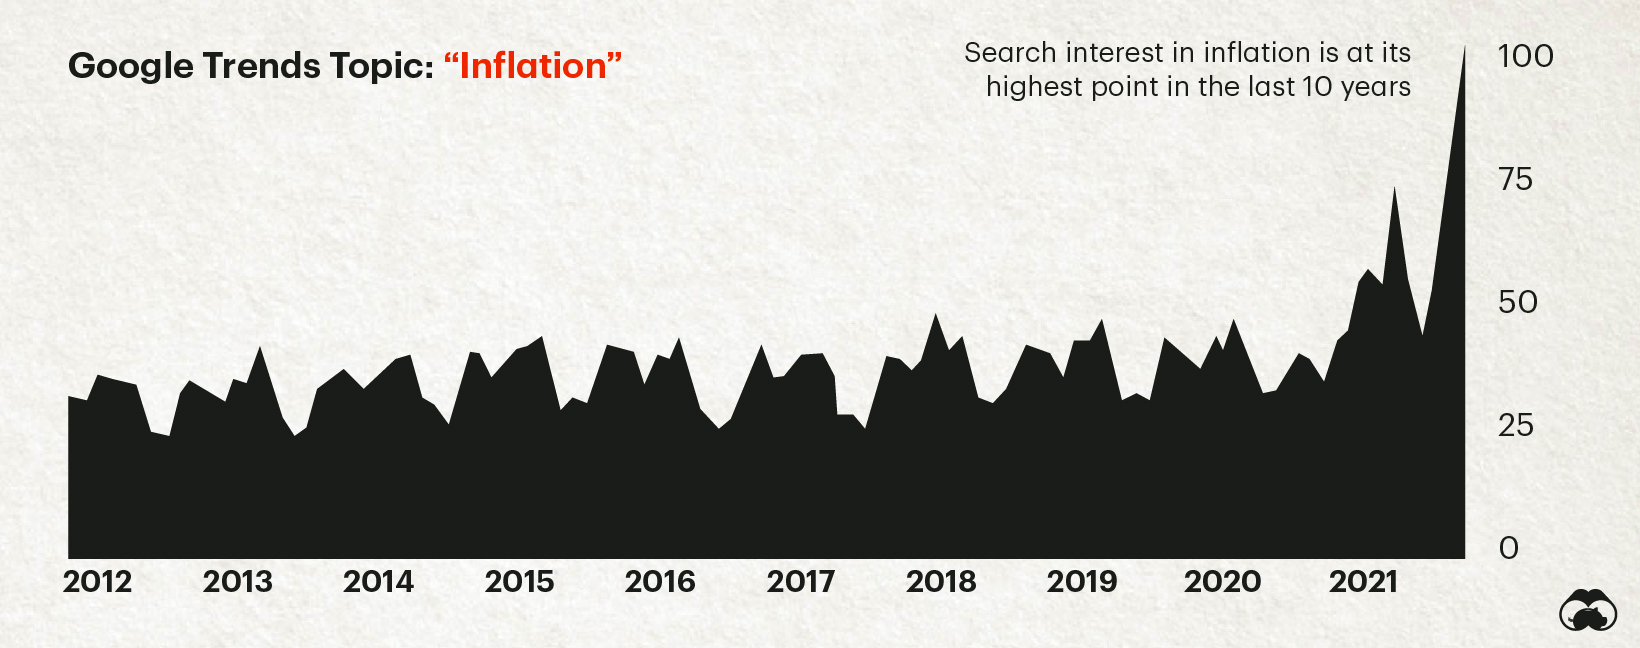
Where is Inflation Hitting the Hardest?
Since 1996, the Federal Reserve has oriented its monetary policy around maintaining 2% inflation annually. For the most part, U.S. inflation over the past couple of decades has typically hovered within a percentage point or two of that target. Right now, most price categories are exceeding that, some quite dramatically. Here’s how various categories of consumer spending have fared over the past 12 months: Of these top-level categories, fuel and transportation have clearly been the hardest hit. Drilling further into the data reveals more nuanced stories as well. Below, we zoom in on five areas of consumer spending that are particularly hard-hit, how much prices have increased over the past year, and why prices are rising so fast:
1. Gasoline (+50%)
Consumers are reeling as prices at the gas pump are up more than a dollar per gallon over the previous year. Simply put, rising demand and constrained global supply are resulting in higher prices. Even as prices have risen, U.S. oil production has seen a slow rebound from the pandemic, as American oil companies are wary of oversupplying the market. Meanwhile, President Biden has identified inflation as a “top priority”, but there are limited tools at the government’s disposal to curb rising prices. For now, Biden has urged the Federal Trade Commission to examine what role energy companies are playing in rising gas prices.
2. Natural Gas (+28%)
Natural gas prices have risen for similar reasons as gasoline. Supply is slow to come back online, and oil and natural gas production in the Gulf of Mexico was adversely affected by Hurricane Ida in September. Compared to the previous winter, households could see their heating bills jump as much as 54%. An estimated 60% of U.S. households heat their homes with fossil fuels, so rising prices will almost certainly have an effect on consumer spending during the holiday season.
3. Used Vehicles (+26%)
The global semiconductor crunch is causing chaos in a number of industries, but the automotive industry is uniquely impacted. Modern vehicles can contain well over a thousand chips, so constrained supply has hobbled production of nearly a million vehicles in the U.S. alone. This chip shortage is having a knock-on effect on the used vehicle market, which jumped by 26% in a single year. The rental car sector is also up by nearly 40% over the same period.
4. Meats (+15%)
Meat producers are facing a few headwinds, and the result is higher prices at the cash register for consumers. Transportation and fuel costs are factoring into rising prices. Constrained labor availability is also an issue for the industry, which was exacerbated by COVID-19 measures. As a top-level category, inflation is high, but in specific animal product categories, such as uncooked beef and bacon, inflation rates have reached double digits over the past 12 months.
5. Furniture and Bedding (+12%)
This category is being influenced by a few factors. The spike in lumber prices along with other raw materials earlier in the year has had obvious impacts. Materials aside, actually shipping these cumbersome goods has been a challenge due to global supply chain issues such a port back-ups.
How Inflation Could Influence Consumer Spending
Rising prices inevitably impact the economy as consumers adjust their buying habits. According to a recent survey, 88% of Americans say they are concerned about U.S. inflation. Here are the top five areas where consumers plan to cut back on their spending:
Will Inflation Continue to Rise in 2022?
Many experts believe that U.S. inflation will decelerate going into 2022, though there’s no consensus on the matter. Improved semiconductor supply and an easing of port congestion around the world could help slow inflation down if nothing goes seriously wrong. That said, if the last few years are any indication, unexpected events could shift the situation at any time. For the near term, consumers will need to adjust to the sticker shock. Source: U.S. Bureau of Labor Statistics – Consumer Price Index (November 10, 2021) Data Note: The Consumer Price Index (CPI) measures the change in prices paid by consumers for goods and services. The CPI reflects spending patterns for each of two population groups: all urban consumers and urban wage earners and clerical workers, which represent about 93% of the total U.S. population. CPIs are based on prices of food, clothing, shelter, fuels, transportation, doctors’ and dentists’ services, drugs, and other goods and services that people buy for day-to-day living. on Today’s connected cars come stocked with as many as 200 onboard sensors, tracking everything from engine temperature to seatbelt status. And all those sensors create reams of data, which will increase exponentially as the autonomous driving revolution gathers pace. With carmakers planning on uploading 50-70% of that data, this has serious implications for policymakers, manufacturers, and local network infrastructure. In this visualization from our sponsor Global X ETFs, we ask the question: will connected cars break the internet?
Data is a Plural Noun
Just how much data could it possibly be? There are lots of estimates out there, from as much as 450 TB per day for robotaxis, to as little as 0.383 TB per hour for a minimally connected car. This visualization adds up the outputs from sensors found in a typical connected car of the future, with at least some self-driving capabilities. The focus is on the kinds of sensors that an automated vehicle might use, because these are the data hogs. Sensors like the one that turns on your check-oil-light probably doesn’t produce that much data. But a 4K camera at 30 frames a second, on the other hand, produces 5.4 TB per hour. All together, you could have somewhere between 1.4 TB and 19 TB per hour. Given that U.S. drivers spend 17,600 minutes driving per year, a vehicle could produce between 380 and 5,100 TB every year. To put that upper range into perspective, the largest commercially available computer storage—the 100 TB SSD Exadrive from Nimbus—would be full in 5 hours. A standard Blu-ray disc (50 GB) would be full in under 2 seconds.
Lag is a Drag
The problem is twofold. In the first place, the internet is better at downloading than uploading. And this makes sense when you think about it. How often are you uploading a video, versus downloading or streaming one? Average global mobile download speeds were 30.78 MB/s in July 2022, against 8.55 MB/s for uploads. Fixed broadband is much higher of course, but no one is suggesting that you connect really, really long network cables to moving vehicles.
Ultimately, there isn’t enough bandwidth to go around. Consider the types of data traffic that a connected car could produce:
Vehicle-to-vehicle (V2V) Vehicle-to-grid (V2G) Vehicles-to-people (V2P) Vehicles-to-infrastructure (V2I) Vehicles-to-everything (V2E)
The network just won’t be able to handle it.
Moreover, lag needs to be relatively non-existent for roads to be safe. If a traffic camera detects that another car has run a red light and is about to t-bone you, that message needs to get to you right now, not in a few seconds.
Full to the Gunwales
The second problem is storage. Just where is all this data supposed to go? In 2021, total global data storage capacity was 8 zettabytes (ZB) and is set to double to 16 ZB by 2025.
One study predicted that connected cars could be producing up to 10 exabytes per month, a thousand-fold increase over current data volumes.
At that rate, 8 ZB will be full in 2.2 years, which seems like a long time until you consider that we still need a place to put the rest of our data too.
At the Bleeding Edge
Fortunately, not all of that data needs to be uploaded. As already noted, automakers are only interested in uploading some of that. Also, privacy legislation in some jurisdictions may not allow highly personal data, like a car’s exact location, to be shared with manufacturers.
Uploading could also move to off-peak hours to even out demand on network infrastructure. Plug in your EV at the end of the day to charge, and upload data in the evening, when network traffic is down. This would be good for maintenance logs, but less useful for the kind of real-time data discussed above.
For that, Edge Computing could hold the answer. The Automotive Edge Computing Consortium has a plan for a next generation network based on distributed computing on localized networks. Storage and computing resources stay closer to the data source—the connected car—to improve response times and reduce bandwidth loads.
Invest in the Future of Road Transport
By 2030, 95% of new vehicles sold will be connected vehicles, up from 50% today, and companies are racing to meet the challenge, creating investing opportunities.
Learn more about the Global X Autonomous & Electric Vehicles ETF (DRIV). It provides exposure to companies involved in the development of autonomous vehicles, EVs, and EV components and materials.
And be sure to read about how experiential technologies like Edge Computing are driving change in road transport in Charting Disruption. This joint report by Global X ETFs and the Wall Street Journal is also available as a downloadable PDF.