This time the fury is targeted towards United Airlines – a brand that is in full-blown crisis mode after a bloodied passenger was forcibly dragged off a plane, and millions of people witnessed videos of the incident being spread over social media. Two days into the crisis, here are some charts that will help give context around what happened, as well as the potential effect on the United brand itself.
Damage Done?
First, let’s take a look at what’s happened to United’s stock price since the incident:
While some public relations crises have minimal effects on the long-term financial performance of companies, this market reaction is an interesting gauge to consider. The stock’s lowest point today was -4.3% below the open, which is equal to a nearly $1 billion loss in market capitalization. At that point, it was speculated that Warren Buffett’s Berkshire Hathaway, which owns 9% of all outstanding shares of United Continental Holdings Inc., could lose up to $87 million. The market clearly saw the crisis as creating risk around United’s fundamental business, but the stock has mostly recovered since those intraday lows. That said, if there are reports of top line revenue being affected because of boycotts or other issues, then the incident’s impact on the stock price could easily re-surface.
Social Media Blowback
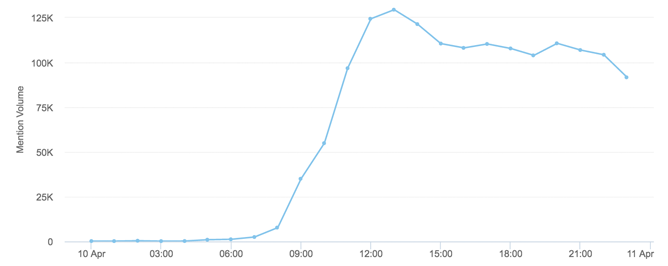
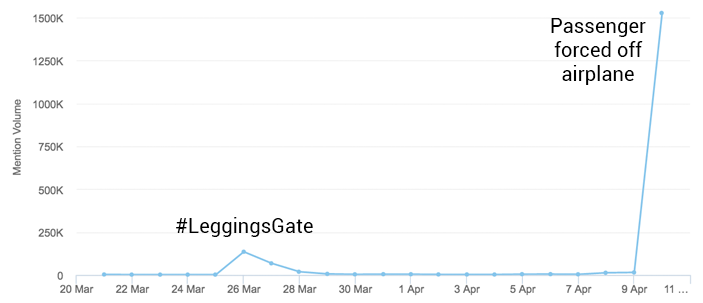
With today’s interconnected world, a public relations crisis can start with one tweet. Here’s the snowball effect in brand mentions of United that occurred on April 10th:
Courtesy of: Brandwatch Here’s another look. This time, it’s a comparison of mentions over the last 21 days.
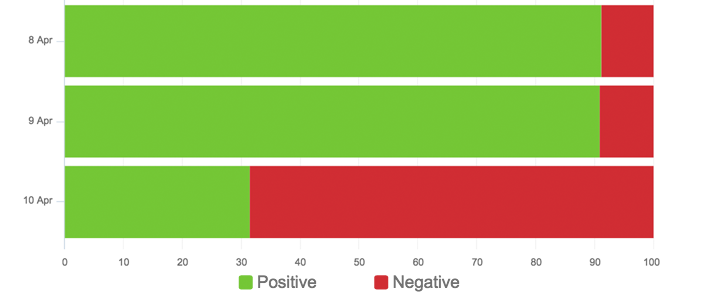
Courtesy of: Brandwatch Yes, it’s only been about two weeks since United’s last PR crisis, called #LeggingsGate. As you can see, however, the most recent disaster is many times worse in terms of mentions. With millions of references to the United Airlines brand occurring on social media, here is the split between positive and negative sentiment as of April 10th::
Courtesy of: Brandwatch
Denied Boarding Rates
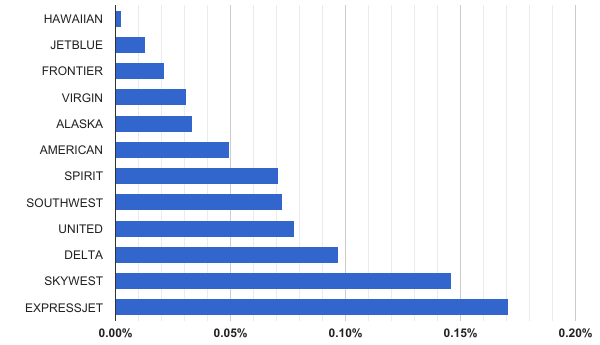
But how big of a problem is making passengers deboard a plane, in the first place? The next chart shows denied boarding rates, inclusive of voluntary and involuntary activity, from January to September 2016:
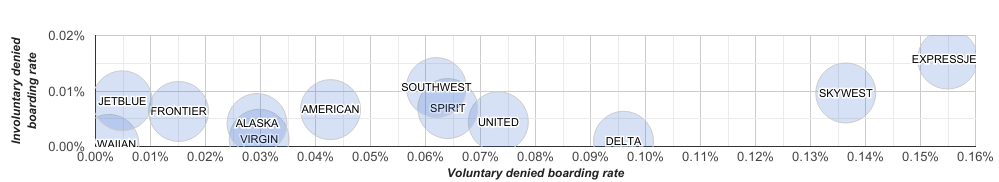
Data: U.S. Dept of Transportation United and Delta are the two worst offenders here, with denied boarding rates that are worse than American, Virgin, Alaska, JetBlue, or Southwest. Lastly, here’s the same figures, except contrasting voluntary vs. involuntary denied boarding rates from January to September 2016:
Data: U.S. Dept of Transportation Southwest and ExpressJet lead the way with the most involuntary denied boardings, and United Airlines is in the middle of the pack. However, in terms of voluntary denied boardings, United and Delta have much higher rates than other major airlines such as American or Virgin.
on The good news is that the Federal Reserve, U.S. Treasury, and Federal Deposit Insurance Corporation are taking action to restore confidence and take the appropriate measures to help provide stability in the market. With this in mind, the above infographic from New York Life Investments looks at the factors that impact bonds, how different types of bonds have historically performed across market environments, and the current bond market volatility in a broader context.
Bond Market Returns
Bonds had a historic year in 2022, posting one of the worst returns ever recorded. As interest rates rose at the fastest pace in 40 years, it pushed bond prices lower due to their inverse relationship. In a rare year, bonds dropped 13%.
Source: FactSet, 01/02/2023.
Bond prices are only one part of a bond’s total return—the other looks at the income a bond provides. As interest rates have increased in the last year, it has driven higher bond yields in 2023.
Source: YCharts, 3/20/2023.
With this recent performance in mind, let’s look at some other key factors that impact the bond market.
Factors Impacting Bond Markets
Interest rates play a central role in bond market dynamics. This is because they affect a bond’s price. When rates are rising, existing bonds with lower rates are less valuable and prices decline. When rates are dropping, existing bonds with higher rates are more valuable and their prices rise. In March, the Federal Reserve raised rates 25 basis points to fall within the 4.75%-5.00% range, a level not seen since September 2007. Here are projections for where the federal funds rate is headed in 2023:
Federal Reserve Projection*: 5.1% Economist Projections**: 5.3%
*Based on median estimates in the March summary of quarterly economic projections.**Projections based on March 10-15 Bloomberg economist survey. Together, interest rates and the macroenvironment can have a positive or negative effect on bonds.
Positive
Here are three variables that may affect bond prices in a positive direction:
Lower Inflation: Reduces likelihood of interest rate hikes. Lower Interest Rates: When rates are falling, bond prices are typically higher. Recession: Can prompt a cut in interest rates, boosting bond prices.
Negative
On the other hand, here are variables that may negatively impact bond prices:
Higher Inflation: Can increase the likelihood of the Federal Reserve to raise interest rates. Rising Interest Rates: Interest rate hikes lead bond prices to fall. Weaker Fundamentals: When a bond’s credit risk gets worse, its price can drop. Credit risk indicates the chance of a default, the risk of a bond issuer not making interest payments within a given time period.
Bonds have been impacted by these negative factors since inflation started rising in March 2021.
Fixed Income Opportunities
Below, we show the types of bonds that have had the best performance during rising rates and recessions.
Source: Derek Horstmeyer, George Mason University 12/3/2022. As we can see, U.S. ultrashort bonds performed the best during rising rates. Mortgage bonds outperformed during recessions, averaging 11.4% returns, but with higher volatility. U.S. long-term bonds had 7.7% average returns, the best across all market conditions. In fact, they were also a close second during recessions. When rates are rising, ultrashort bonds allow investors to capture higher rates when they mature, often with lower historical volatility.
A Closer Look at Bond Market Volatility
While bond market volatility has jumped this year, current dislocations may provide investment opportunities. Bond dislocations allow investors to buy at lower prices, factoring in that the fundamental quality of the bond remains strong. With this in mind, here are two areas of the bond market that may provide opportunities for investors:
Investment-Grade Corporate Bonds: Higher credit quality makes them potentially less vulnerable to increasing interest rates. Intermediate Bonds (2-10 Years): Allow investors to lock in higher rates.
Both types of bonds focus on quality and capturing higher yields when faced with challenging market conditions.
Finding the Upside
Much of the volatility seen in the banking sector was due to banks buying bonds during the pandemic—or even earlier—at a time when interest rates were historically low. Since then, rates have climbed considerably. Should rates moderate or stop increasing, this may present better market conditions for bonds. In this way, today’s steep discount in bond markets may present an attractive opportunity for price appreciation. At the same time, investors can potentially lock in strong yields as inflation may subside in the coming years ahead. Learn more about bond investing strategies with New York Life Investments.
![]()
![]()