Using the most recent data on global trade from the U.S. Census Bureau and the U.S. Bureau of Economic Analysis, we take a closer look at the value of American goods imports and visualize them state by state.
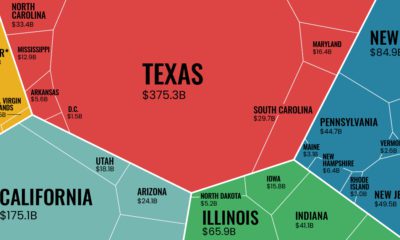
The Top 10 Importing States, by Total Goods Value
The top 10 states by import value account for 64.5% of all U.S. imports, or $1.8 trillion. Overall, the goods trade deficit—the amount by which a country’s imports exceed its exports—was more than $1 trillion in 2021, increasing over 18% from the previous year. Goods imports specifically increased by nearly $502 billion, a 21% increase year-over-year. California, the U.S.’s top importer, saw over $470 billion worth of goods come in last year. Some of its big ticket items fell in line with the state’s tech sector’s needs, like automatic data processing machines and accessories and parts for said machinery. California’s own deficit is quite high—the state’s goods exports were only valued at approximately $175 billion. The state’s busy ports are a key entry point for goods arriving from Asia, which helps explain this deficit. In contrast, the country’s top export state is Texas at $375 billion, outweighing its imports and shipping out goods like coal and petroleum. All but three of the country’s top importers—Tennessee, Pennsylvania, and Georgia—were also among the country’s top 10 exporters.
Where are Imports Coming From?
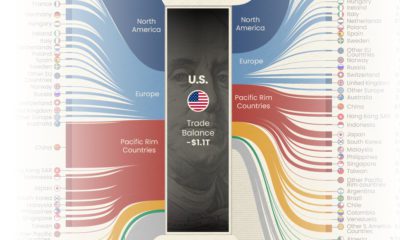
Here’s a look at the country’s top trade partners for goods imports and the value of their imports in 2022 as of April. Over half of the top import partners for the United States are located in Asia. China is by far America’s top source of goods, making up 17% of the country’s imports. Meanwhile, Canada and Mexico each account for roughly 14% of America’s goods imports due to the close proximity, strong economic ties, and trade agreements.
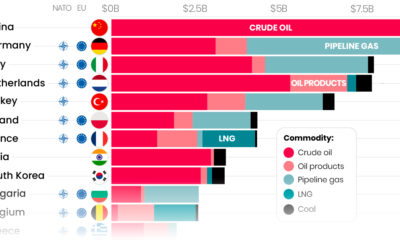
What’s Being Imported?
Imports of goods increased to a value of $2.8 trillion in 2021, the highest on record. According to the U.S. Census Bureau, industrial supplies and materials and crude oil saw some of the most notable increases. Consumer goods like cell phones, household goods, toys, games, and sporting equipment increased in import value as well, reflecting a trend that the pandemic’s online shopping and delivery demand started. Additionally, imports of foods, feeds, and beverages were the highest on record in 2021. It is also notable that in April of 2022, exports of goods hit the highest number on record at nearly $175 billion, with exports of feeds, food, and beverage also reaching the highest number of exports recorded. This is likely attributed to food shortages worldwide caused by the war in Ukraine. on Both figures surpassed analyst expectations by a wide margin, and in January, the unemployment rate hit a 53-year low of 3.4%. With the recent release of February’s numbers, unemployment is now reported at a slightly higher 3.6%. A low unemployment rate is a classic sign of a strong economy. However, as this visualization shows, unemployment often reaches a cyclical low point right before a recession materializes.
Reasons for the Trend
In an interview regarding the January jobs data, U.S. Treasury Secretary Janet Yellen made a bold statement: While there’s nothing wrong with this assessment, the trend we’ve highlighted suggests that Yellen may need to backtrack in the near future. So why do recessions tend to begin after unemployment bottoms out?
The Economic Cycle
The economic cycle refers to the economy’s natural tendency to fluctuate between periods of growth and recession. This can be thought of similarly to the four seasons in a year. An economy expands (spring), reaches a peak (summer), begins to contract (fall), then hits a trough (winter). With this in mind, it’s reasonable to assume that a cyclical low in the unemployment rate (peak employment) is simply a sign that the economy has reached a high point.
Monetary Policy
During periods of low unemployment, employers may have a harder time finding workers. This forces them to offer higher wages, which can contribute to inflation. For context, consider the labor shortage that emerged following the COVID-19 pandemic. We can see that U.S. wage growth (represented by a three-month moving average) has climbed substantially, and has held above 6% since March 2022. The Federal Reserve, whose mandate is to ensure price stability, will take measures to prevent inflation from climbing too far. In practice, this involves raising interest rates, which makes borrowing more expensive and dampens economic activity. Companies are less likely to expand, reducing investment and cutting jobs. Consumers, on the other hand, reduce the amount of large purchases they make. Because of these reactions, some believe that aggressive rate hikes by the Fed can either cause a recession, or make them worse. This is supported by recent research, which found that since 1950, central banks have been unable to slow inflation without a recession occurring shortly after.
Politicians Clash With Economists
The Fed has raised interest rates at an unprecedented pace since March 2022 to combat high inflation. More recently, Fed Chairman Jerome Powell warned that interest rates could be raised even higher than originally expected if inflation continues above target. Senator Elizabeth Warren expressed concern that this would cost Americans their jobs, and ultimately, cause a recession. Powell remains committed to bringing down inflation, but with the recent failures of Silicon Valley Bank and Signature Bank, some analysts believe there could be a pause coming in interest rate hikes. Editor’s note: just after publication of this article, it was confirmed that U.S. interest rates were hiked by 25 basis points (bps) by the Federal Reserve.