In 2011, around 55,000 electric vehicles (EVs) were sold around the world. 10 years later in 2021, that figure had grown close to 7 million vehicles. With many countries getting plugged into electrification, the global EV market has seen exponential growth over the last decade. Using data from the International Energy Agency (IEA), this infographic shows the explosion in global EV sales since 2011, highlighting the countries that have grown into the biggest EV markets.
The Early EV Days
From 2011 to 2015, global EV sales grew at an average annual rate of 89%, with roughly one-third of global sales occurring in the U.S. alone. In 2014, the U.S. was the largest EV market followed by China, the Netherlands, Norway, and France. But things changed in 2015, when China’s EV sales grew by 238% relative to 2014, propelling it to the top spot. China’s growth had been years in the making, with the government offering generous subsidies for electrified cars, in addition to incentives and policies that encouraged production. In 2016, Chinese consumers bought more EVs than the rest of the world combined—and the country hasn’t looked back, accounting for over half of global sales in 2021.
EV Sales by Country in 2021
After remaining fairly flat in 2019, global EV sales grew by 38% in 2020, and then more than doubled in 2021. China was the driver of the growth—the country sold more EVs in 2021 than the rest of the world combined in 2020. China has nearly 300 EV models available for purchase, more than any other country, and it’s also home to four of the world’s 10 largest battery manufacturers. Moreover, the median price of electric cars in China is just 10% more than conventional cars, compared to 45-50% on average in other major markets. Germany, Europe’s biggest auto market, sold nearly 700,000 EVs in 2021, up 72% from 2020. The country hosts some of the biggest EV factories in Europe, with Tesla, Volkswagen, and Chinese battery giant CATL either planning or operating ‘gigafactories’ there. Overall, sales in Europe increased by 65% in 2021, as evidenced by the seven European countries in the above list. The U.S. also made a comeback after a two-year drop, with EV sales more than doubling in 2021. The growth was supported by a 24% increase in EV model availability, and also by an increase in production of Tesla models, which accounted for half of U.S. EV sales.
Tesla’s Dominance in the U.S.
Tesla is the world’s most renowned electric car company and its dominance in the U.S. is unmatched. Between 2011 and 2019, Tesla accounted for 40% of all EVs sold in the United States. Furthermore, Tesla cars have been the top-selling EV models in the U.S. in every year since 2015. *Estimates Share of total sales calculated using total U.S. EV sales of 631,152 units, based on data from the IEA. Source: Cleantechnica Tesla accounted for over 50% of EV sales in the U.S. in 2021 with the Model Y—launched in 2019—taking the top spot. Furthermore, the Model Y remained the bestselling EV in the first quarter of 2022, with Tesla taking up a massive 75% of the EV market share. Despite Tesla’s popularity, it could face a challenge as other automakers roll out new models and expand EV production. For example, General Motors aims to make 20 EV models available by 2025, and Ford expects to produce at least 2 million EVs annually by 2026. This increase in competition from incumbents and new entrants could eat away at Tesla’s market share in the coming years. on
#1: High Reliability
Nuclear power plants run 24/7 and are the most reliable source of sustainable energy. Nuclear electricity generation remains steady around the clock throughout the day, week, and year. Meanwhile, daily solar generation peaks in the afternoon when electricity demand is usually lower, and wind generation depends on wind speeds.As the use of variable solar and wind power increases globally, nuclear offers a stable and reliable backbone for a clean electricity grid.
#2: Clean Electricity
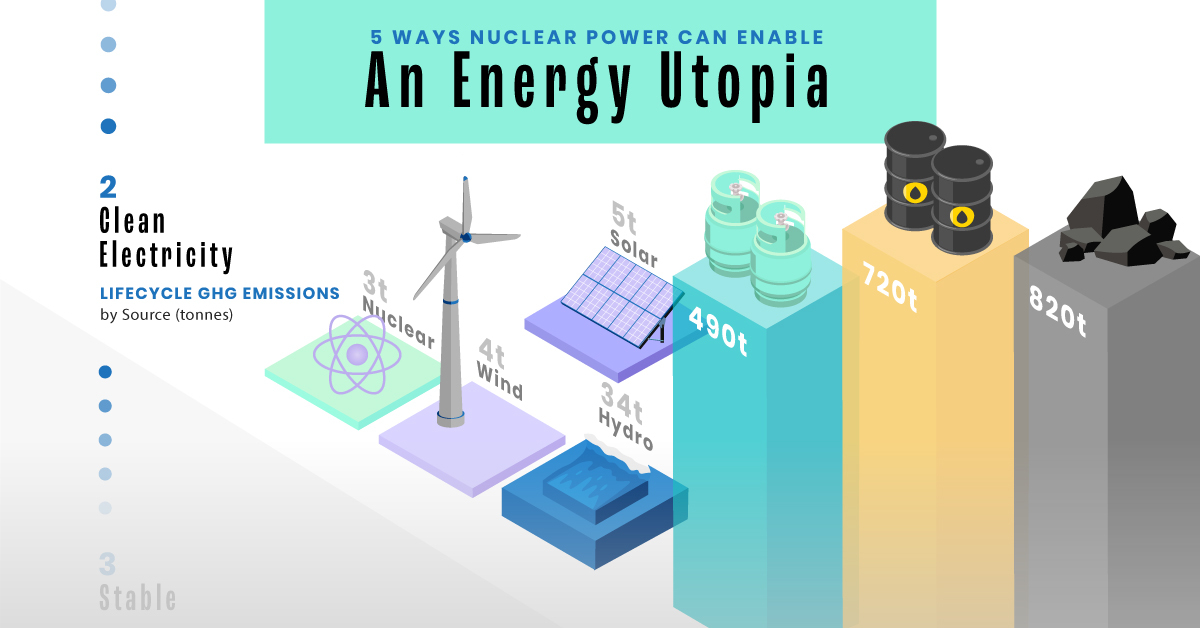
Nuclear reactors use fission to generate electricity without any greenhouse gas (GHG) emissions.Consequently, nuclear power is the cleanest energy source on a lifecycle basis, measured in CO2-equivalent emissions per gigawatt-hour (GWh) of electricity produced by a power plant over its lifetime. The lifecycle emissions from a typical nuclear power plant are 273 times lower than coal and 163 times lower than natural gas. Furthermore, nuclear is relatively less resource-intensive, allowing for lower supply chain emissions than wind and solar plants.
#3: Stable Affordability
Although nuclear plants can be expensive to build, they are cost-competitive in the long run. Most nuclear plants have an initial lifetime of around 40 years, after which they can continue operating with approved lifetime extensions. Nuclear plants with lifetime extensions are the cheapest sources of electricity in the United States, and 88 of the country’s 92 reactors have received approvals for 20-year extensions. Additionally, according to the World Nuclear Association, nuclear plants are relatively less susceptible to fuel price volatility than natural gas plants, allowing for stable costs of electricity generation.
#4: Energy Efficiency
Nuclear’s high energy return on investment (EROI) exemplifies its exceptional efficiency. EROI measures how many units of energy are returned for every unit invested in building and running a power plant, over its lifetime. According to a 2018 study by Weissbach et al., nuclear’s EROI is 75 units, making it the most efficient energy source by some distance, with hydropower ranking second at 35 units.
#5: Sustainable Innovation
New, advanced reactor designs are bypassing many of the difficulties faced by traditional nuclear plants, making nuclear power more accessible.
Small Modular Reactors (SMRs) are much smaller than conventional reactors and are modular—meaning that their components can be transported and assembled in different locations. Microreactors are smaller than SMRs and are designed to provide electricity in remote and small market areas. They can also serve as backup power sources during emergencies.
These reactor designs offer several advantages, including lower initial capital costs, portability, and increased scalability.
A Nuclear-Powered Future
Nuclear power is making a remarkable comeback as countries work to achieve climate goals and ultimately, a state of energy utopia. Besides the 423 reactors in operation worldwide, another 56 reactors are under construction, and at least 69 more are planned for construction. Some nations, like Japan, have also reversed their attitudes toward nuclear power, embracing it as a clean and reliable energy source for the future. CanAlaska is a leading exploration company in the Athabasca Basin, the Earth’s richest uranium depository. Click here to learn more now. In part 3 of the Road to Energy Utopia series, we explore the unique properties of uranium, the fuel that powers nuclear reactors.


