- Earning trajectory is largely determined by the time a person is 35-years-old 2) Income is positively correlated with age How do these beliefs stand up to the actual income data? As it turns out, quite well. Today’s data, from the IPUMS.org Current Population Survey, is a detailed look at income by age group.
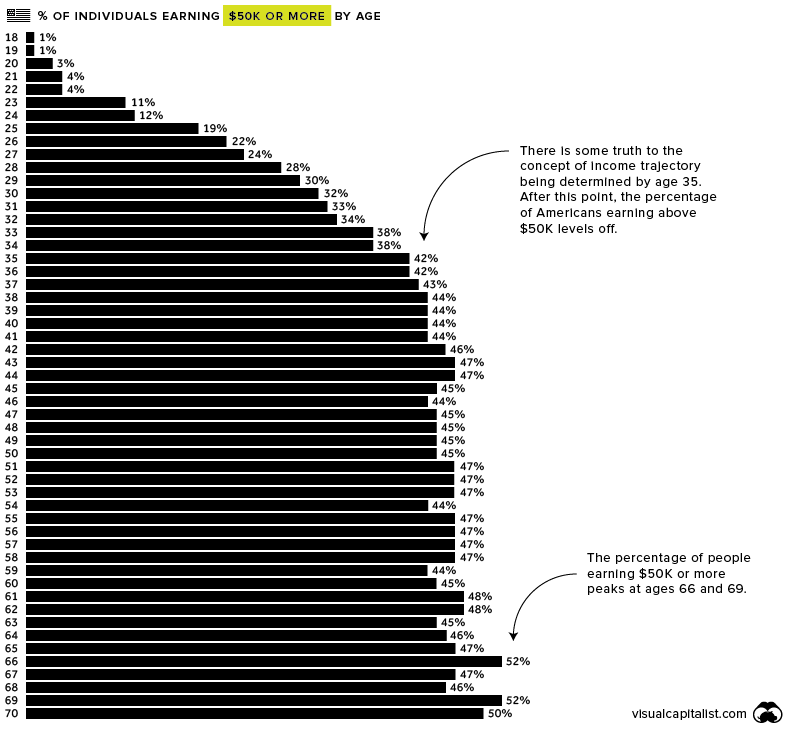
The $50K Threshold
In the age of LinkedIn bragging it’s no surprise that two-thirds of people who are being paid the market rate believe they’re actually underpaid. For people just starting out in the workforce, there can be a lot of pressure to earn a higher salary, but as the data shows, only a tiny percentage of workers under the age of 25 surpass a salary of $50K.
The majority of people in the work force make their greatest income strides between the ages of 30 and 35, with median income jumping by 26% during that short time-frame. After the age of 35, the percentage of people earning $50K or more is surprisingly consistent until retirement age, hovering between 42% and 48%.
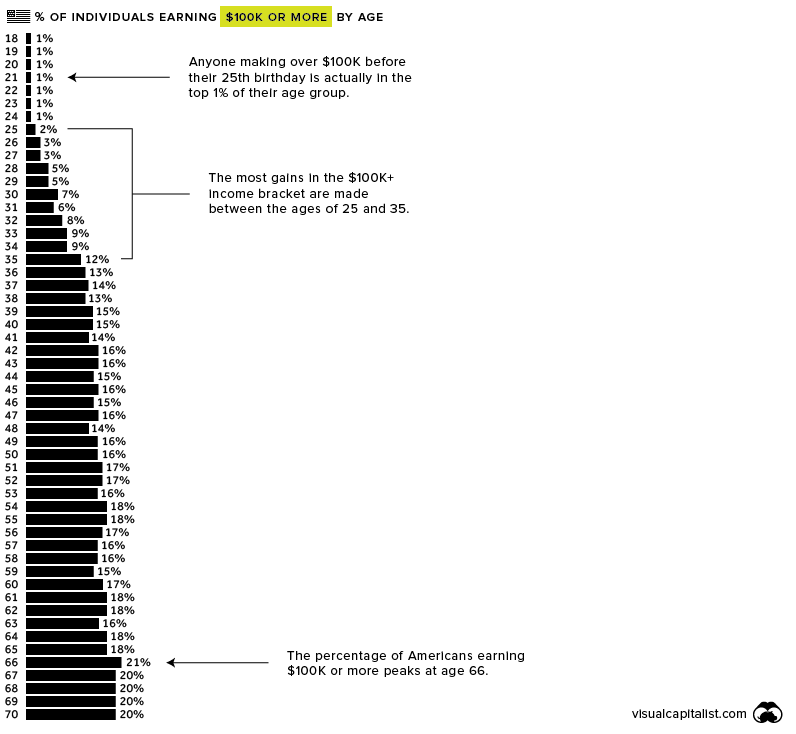
The $100K Threshold
Making $100K per year won’t put you in the top 1% – you’ll need to earn $300K to join that club – however, it’s still enough to live comfortably in most places in America. Approximately 21 million people in the U.S. workforce earn over $100K. Here’s how they break down by age.
Interestingly, the percentage of Americans earning $100K or more jumps from 2% to 12%, and moves very little after that. Put another way, it’s rare for anyone in their 20s to earn over $100K, but many people who hit that threshold do so by the time they turn 40. Much like those earning $50K or more, the percentage of $100K+ earners stays fairly consistent until retirement, peaking at age 66. Individual salary situations will vary widely, of course, but it’s interesting to zoom out at the big picture of income in America. on To see how the minimum wage differs around the world, we’ve visualized data from Picodi, which includes values for 67 countries as of January 2023.
Monthly Minimum Wage, by Country
The following table includes all of the data used in this infographic. Each value represents the monthly minimum wage a full-time worker would receive in each country. Picodi states that these figures are net of taxes and have been converted to USD. Generally speaking, developed countries have a higher cost of living, and thus require a higher minimum wage. Two outliers in this dataset are Argentina and Turkey, which have increased their minimum wages by 100% or more from January 2022 levels. Turkey is suffering from an ongoing currency crisis, with the lira losing over 40% of its value in 2021. Prices of basic goods have increased considerably as the Turkish lira continues to plummet. In fact, a 2022 survey found that 70% of people in Turkey were struggling to pay for food. Argentina, South America’s second-biggest economy, is also suffering from very high inflation. In response, the country announced three minimum wage increases throughout 2022.
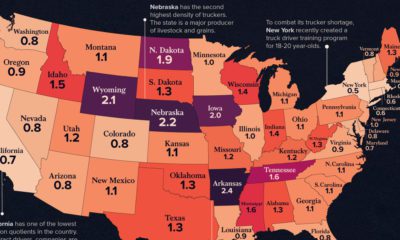
Minimum Wage in the U.S.
Within the U.S., minimum wage varies significantly by state. We’ve visualized each state’s basic minimum rate (hourly) using January 2023 data from the U.S. Department of Labor.
2023-03-17 Update: This map was updated to fix several incorrect values. We apologize for any confusion this may have caused. America’s federal minimum wage has remained unchanged since 2009 at $7.25 per hour. Each state is allowed to set their own minimum wage, as long as it’s higher than the federal minimum. In states that do not set their own minimum, the federal minimum applies. If we assume someone works 40 hours a week, the federal minimum wage of $7.25 translates to an annual figure of just $15,080 before taxes. California’s minimum wage of $15.50 translates to $32,240 before taxes. For further perspective, check out our 2022 infographic on the salary needed to buy a home across 50 U.S. cities.