Based on data presented by the Aqal Group and the IEA, here we visualize the countries and regions with the highest per capita carbon emissions from around the world. Let’s dive into the highest per capita carbon emitters and how they are trying to reduce their carbon contributions.
Leaders in Per Capita CO2 Emissions
Oil-producing countries in the Middle East are the highest emitters of CO2 on a per capita basis, but developed countries like the U.S., Australia, New Zealand, and Canada also have some of the higher rates of per capita emissions. *Middle East A group includes Bahrain, Oman, Kuwait, Qatar, and United Arab Emirates Canada and the United States have per capita carbon footprints of 15.2 and 14.4 tonnes per year, respectively. Meanwhile, Australia and New Zealand combine for an average per capita footprint of over 13.6 tonnes per year. It’s worth noting that all of these numbers are more than three times higher than the global average, which in 2019 was 4.4 tonnes per person.
Energy Sources and Per Capita CO2 Emissions
Since there is a strong relationship between wealth and per capita CO2 emissions, we’d expect countries with high living standards to have a high carbon footprint. But the data above shows significant differences in per capita emissions, even between countries with similar living standards. Many countries across Europe, for example, have much lower emissions than the U.S., Canada, or Australia. Here’s a look at the top 25 countries by standard of living and their share of electricity production from fossil fuels: Sources: Electricity consumption, Fossil fuel mix The choice of energy sources plays a key role here. In the UK, Portugal, and France, a much higher share of electricity is produced from nuclear and renewable sources. For example, only 9.5% of France’s electricity production comes from fossil fuels, compared to other developed countries like the U.S. at 60.1% and Japan at 69.1%.
G20 Countries and Carbon Emissions
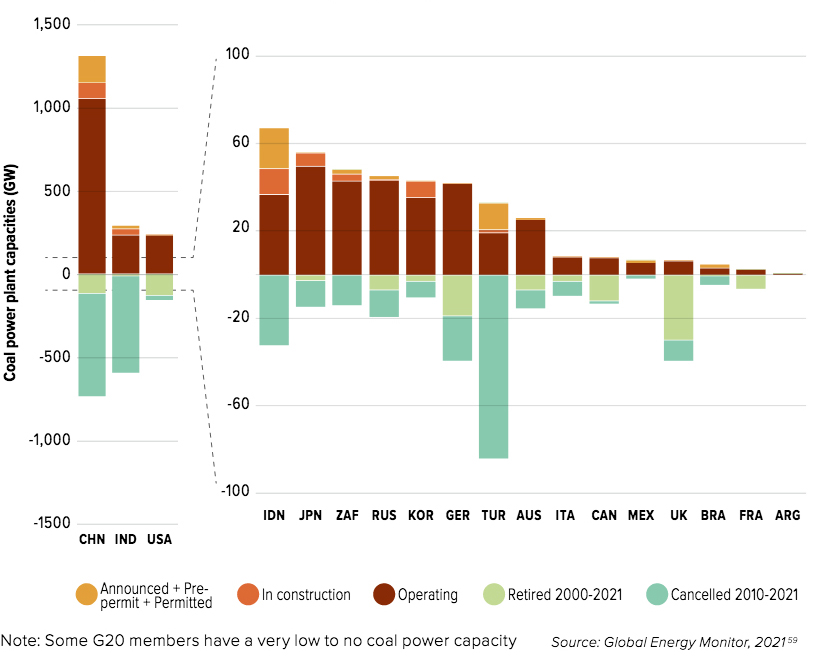
This reliance on fossil fuels for energy production extends to the rest of the G20 countries. According to the Climate Transparency Report, CO2 emissions will rise by 4% across the G20 group this year, dropping 6% in 2020 due to the pandemic. This rise is mainly due to the increase in coal consumption across these countries. Coal consumption is projected to rise by almost 5% in 2021, with this growth driven by China (accounting for 61% of the growth), the U.S. (18%), and India (17%). Here’s a look at the current coal power capacity of each G20 country:
Coal use in China has surged, with the country experiencing increased demand for energy as the global economy has recovered. Coal prices are up nearly 200% from a year ago.
Plans to Tackle Emissions
The conclusion of the U.N. Climate Change Conference (COP26) in Glasgow saw several pledges and announcements being made by various countries. Here are some of the highlights:
The world’s biggest CO2 emitters, the U.S. and China, pledged to cooperate more over the next decade in areas including methane emissions and the switch to clean energy. Leaders from more than 100 countries—with about 85% of the world’s forests—promised to stop deforestation by 2030. More than 100 countries agreed upon a scheme to cut 30% of methane emissions by 2030. Financial organizations have agreed to back renewable energy and direct finance away from fossil fuel-burning industries.
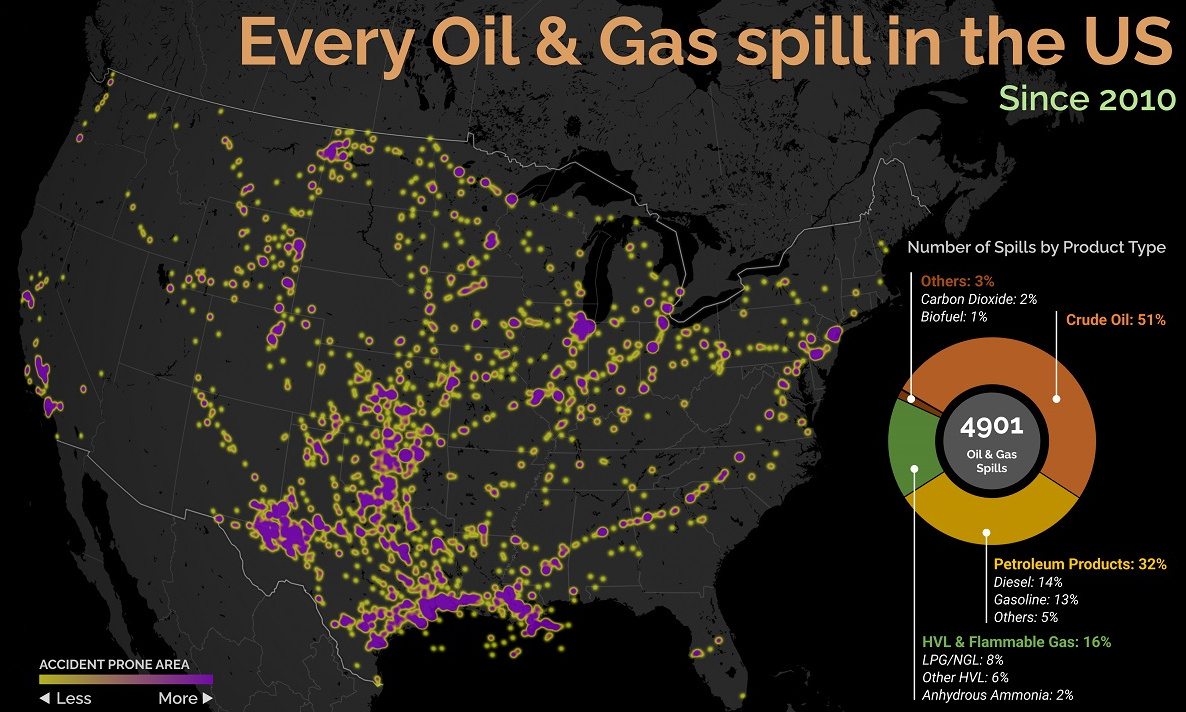
Many countries have pledged to do their part to tackle climate change. It will be an impressive display of global unity if global CO2 emissions drop significantly over the next decade. on Aside from the obvious climate impact they bring, one other downside in particular is spills, which can lead to ecological and economic damage. These can happen due to pipeline leaks, train derailments, or other industrial disasters. This graphic from Preyash Shah provides a visual overview of every oil and gas spill in the contiguous U.S. since 2010. Data is tracked by the U.S. government’s Pipeline and Hazardous Materials Safety Administration (PHMSA).
U.S. Oil and Gas Spills (2010‒2022)
The majority of spills that have occurred come mostly from crude oil, followed by petroleum products and gas. Note that this data covers the quantity of spills and not damages or volume.
Crude oil, which makes up just over half of documented spills, is also one of the most costly. Contaminations can persist for years after a spill, and its impact on local mammals and waterfowl is particularly harsh. This has been the case with the Deepwater Horizon spill (also known as the “BP oil spill”), which experts say is still causing harm in the Gulf of Mexico. Other products with lots of spills include petroleum products such as diesel or gasoline, as well as liquefied natural gas or other volatile liquids. Interestingly, liquefied carbon dioxide can also be transported in pipelines, commonly used for carbon capture storage, but requires high pressure to maintain its state. When looking at the location of spills, it’s clear that the South Central states have experienced the highest number of disasters. In contrast, the West Coast has had substantially less activity. However, this makes much more sense when looking at the dominant oil producing states, where Texas and surrounding neighbors reign supreme. Of the 4,901 spills during this period, Texas accounts for 1,936 or roughly 40% of all oil and gas spills. This is followed by Oklahoma, which has had 407 spills and is one of the largest net exporters of oil and gas in the country.
What Causes Spills?
Oil and gas spills actually have a surprisingly long history, with one of the earliest dating back to 1889, when a spill was reported on the coast between Los Angeles and San Diego. Causes have consisted primarily of weather, natural disasters, equipment and technological malfunction, as well as human error. However, they only became a widespread problem around the halfway mark of the 20th century, when petroleum extraction and production really began to take off. This era also saw the emergence of supertankers, which can transport half a million tons of oil but therefore make the risk of spills even costlier. In fact, the biggest spill off U.S. waters after the Deepwater Horizon disaster is the 1989 Exxon Valdez spill in Alaska, when a tanker crashed into a reef and 11 million gallons of oil spilled into the Pacific Ocean.