This graphic, using data from a report by Verisk Maplecroft, looks at the world’s top cities for foreign direct investment (FDI) and assesses their relative levels of social risk. In the article below, we’ll take a look at the research methodology to explain how risk was assessed in the report and touch on some key markets that placed high on the ranking.
The Relationship Between FDI and Social Risk
To look at the relationship between FDI and social risk, the report identified the top 100 cities for FDI in 2020, using data from fDi Markets (the Financial Times’ foreign investment monitor).
From there, social risk in the top 100 FDI cities was measured using data from Verisk Maplecroft’s Cities@Risk Social Index. The index measures the social risk landscape of 575 different cities across the globe, using three key pillars:
Civil and political rights: the right to protest, security force abuses Labor rights: child labor, modern slavery Poverty: portion of population in extreme poverty
After calculating scores based on these three metrics, cities were then grouped into four categories to measure their level of social risk:
Low risk Medium risk High risk Extreme risk
Based on this analysis, citizens in 33 of the top 100 cities for FDI (representing $71 billion of inward investment) are at ‘high’ or ‘extreme’ levels of social risk, meaning they face significant threats to their civil, political, and labor rights. Of the top 100 places, Istanbul and Izmir rank the highest when it comes to overall human rights risks, largely because of labor rights violations and the exploitation of migrant and refugee workers. This is something manufacturers should take note of, especially those who outsource production to these Turkish cities. In contrast, Beijing, which places third on the list, scores high due to China’s various civil rights issues. Other major manufacturing and commercial hubs in China, like Guangzhou and Shanghai, place high on the list as well.
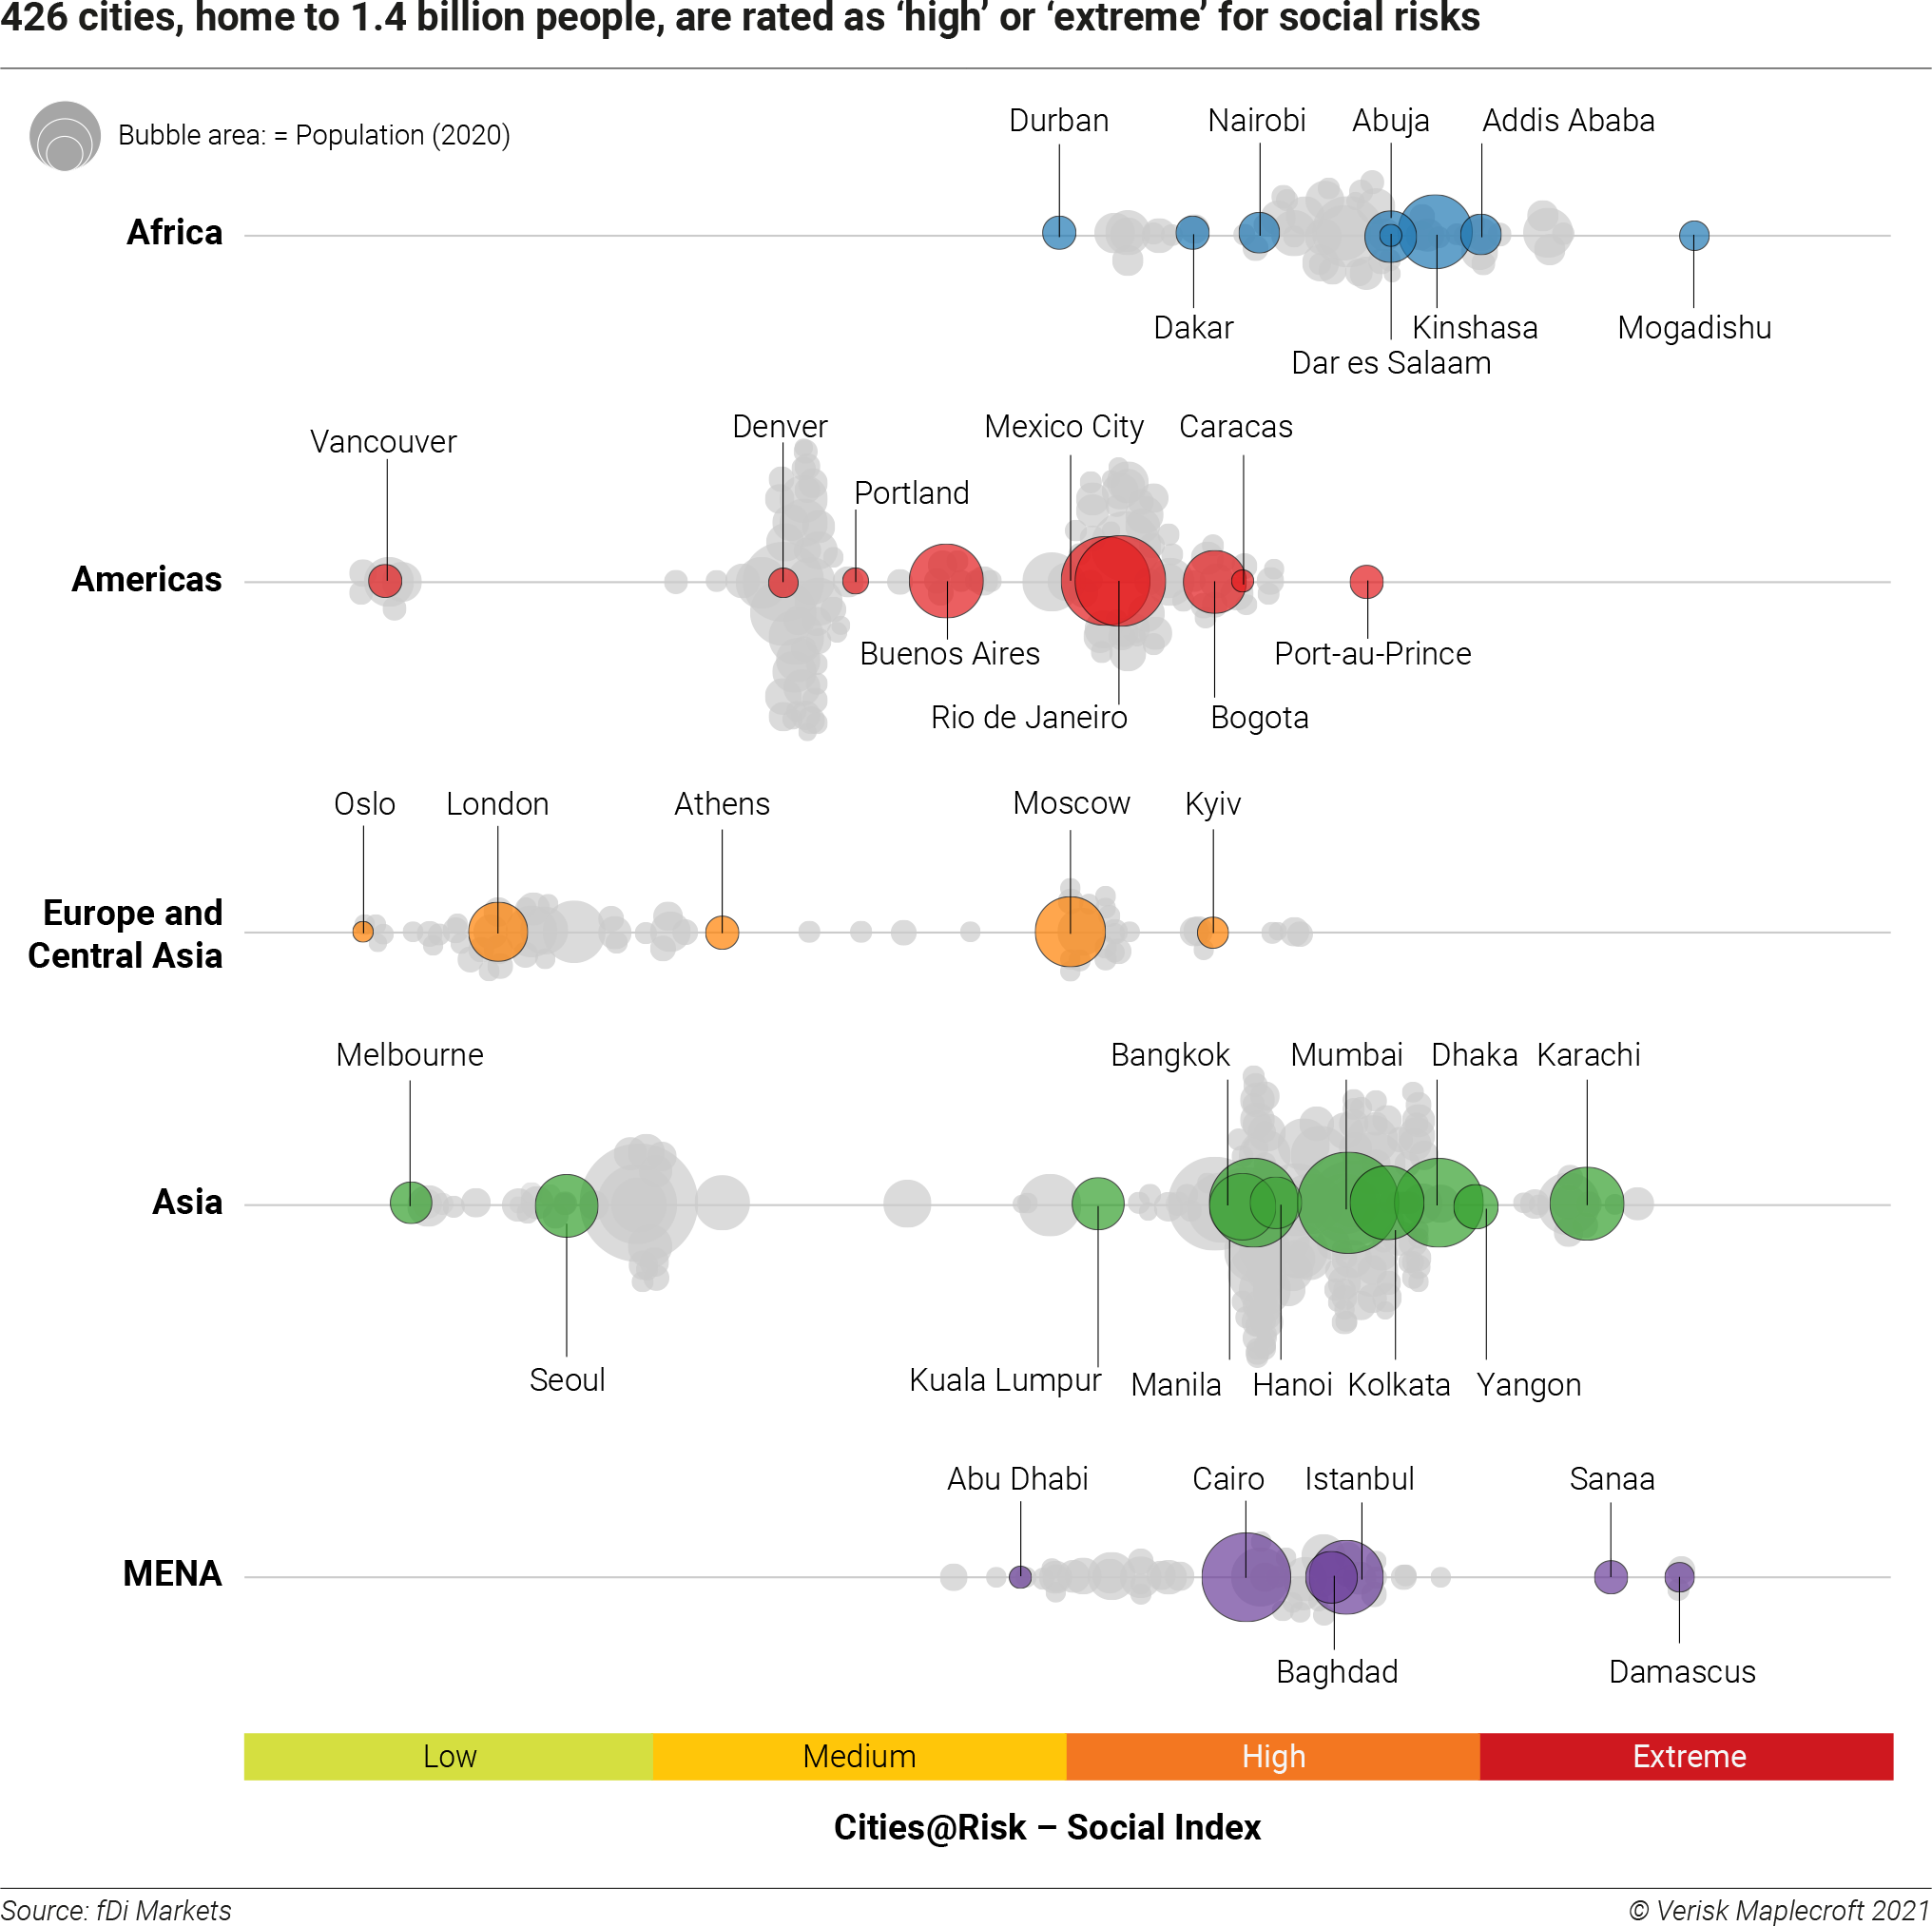
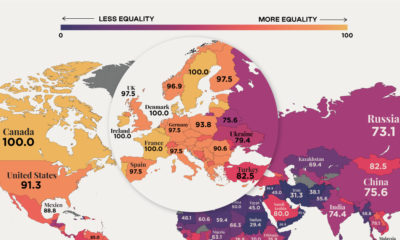
Overall Social Risk Index
While a third of the top FDI cities are at high or extreme social risk, this figure is even higher when looking at all 575 cities included in the Cities@Risk Social Index.
Of the 575 cities, 75% are classified as ‘high’ or ‘extreme’ risk. Mogadishu, Somalia is the highest risk city, followed by Damascus, Aleppo, and Homs in Syria, Pyongyang in North Korea, and Sanaa in Yemen. While the high-risk cities are spread across the globe, it’s worth noting that 240 of the high and extreme risk cities are located in Asia.
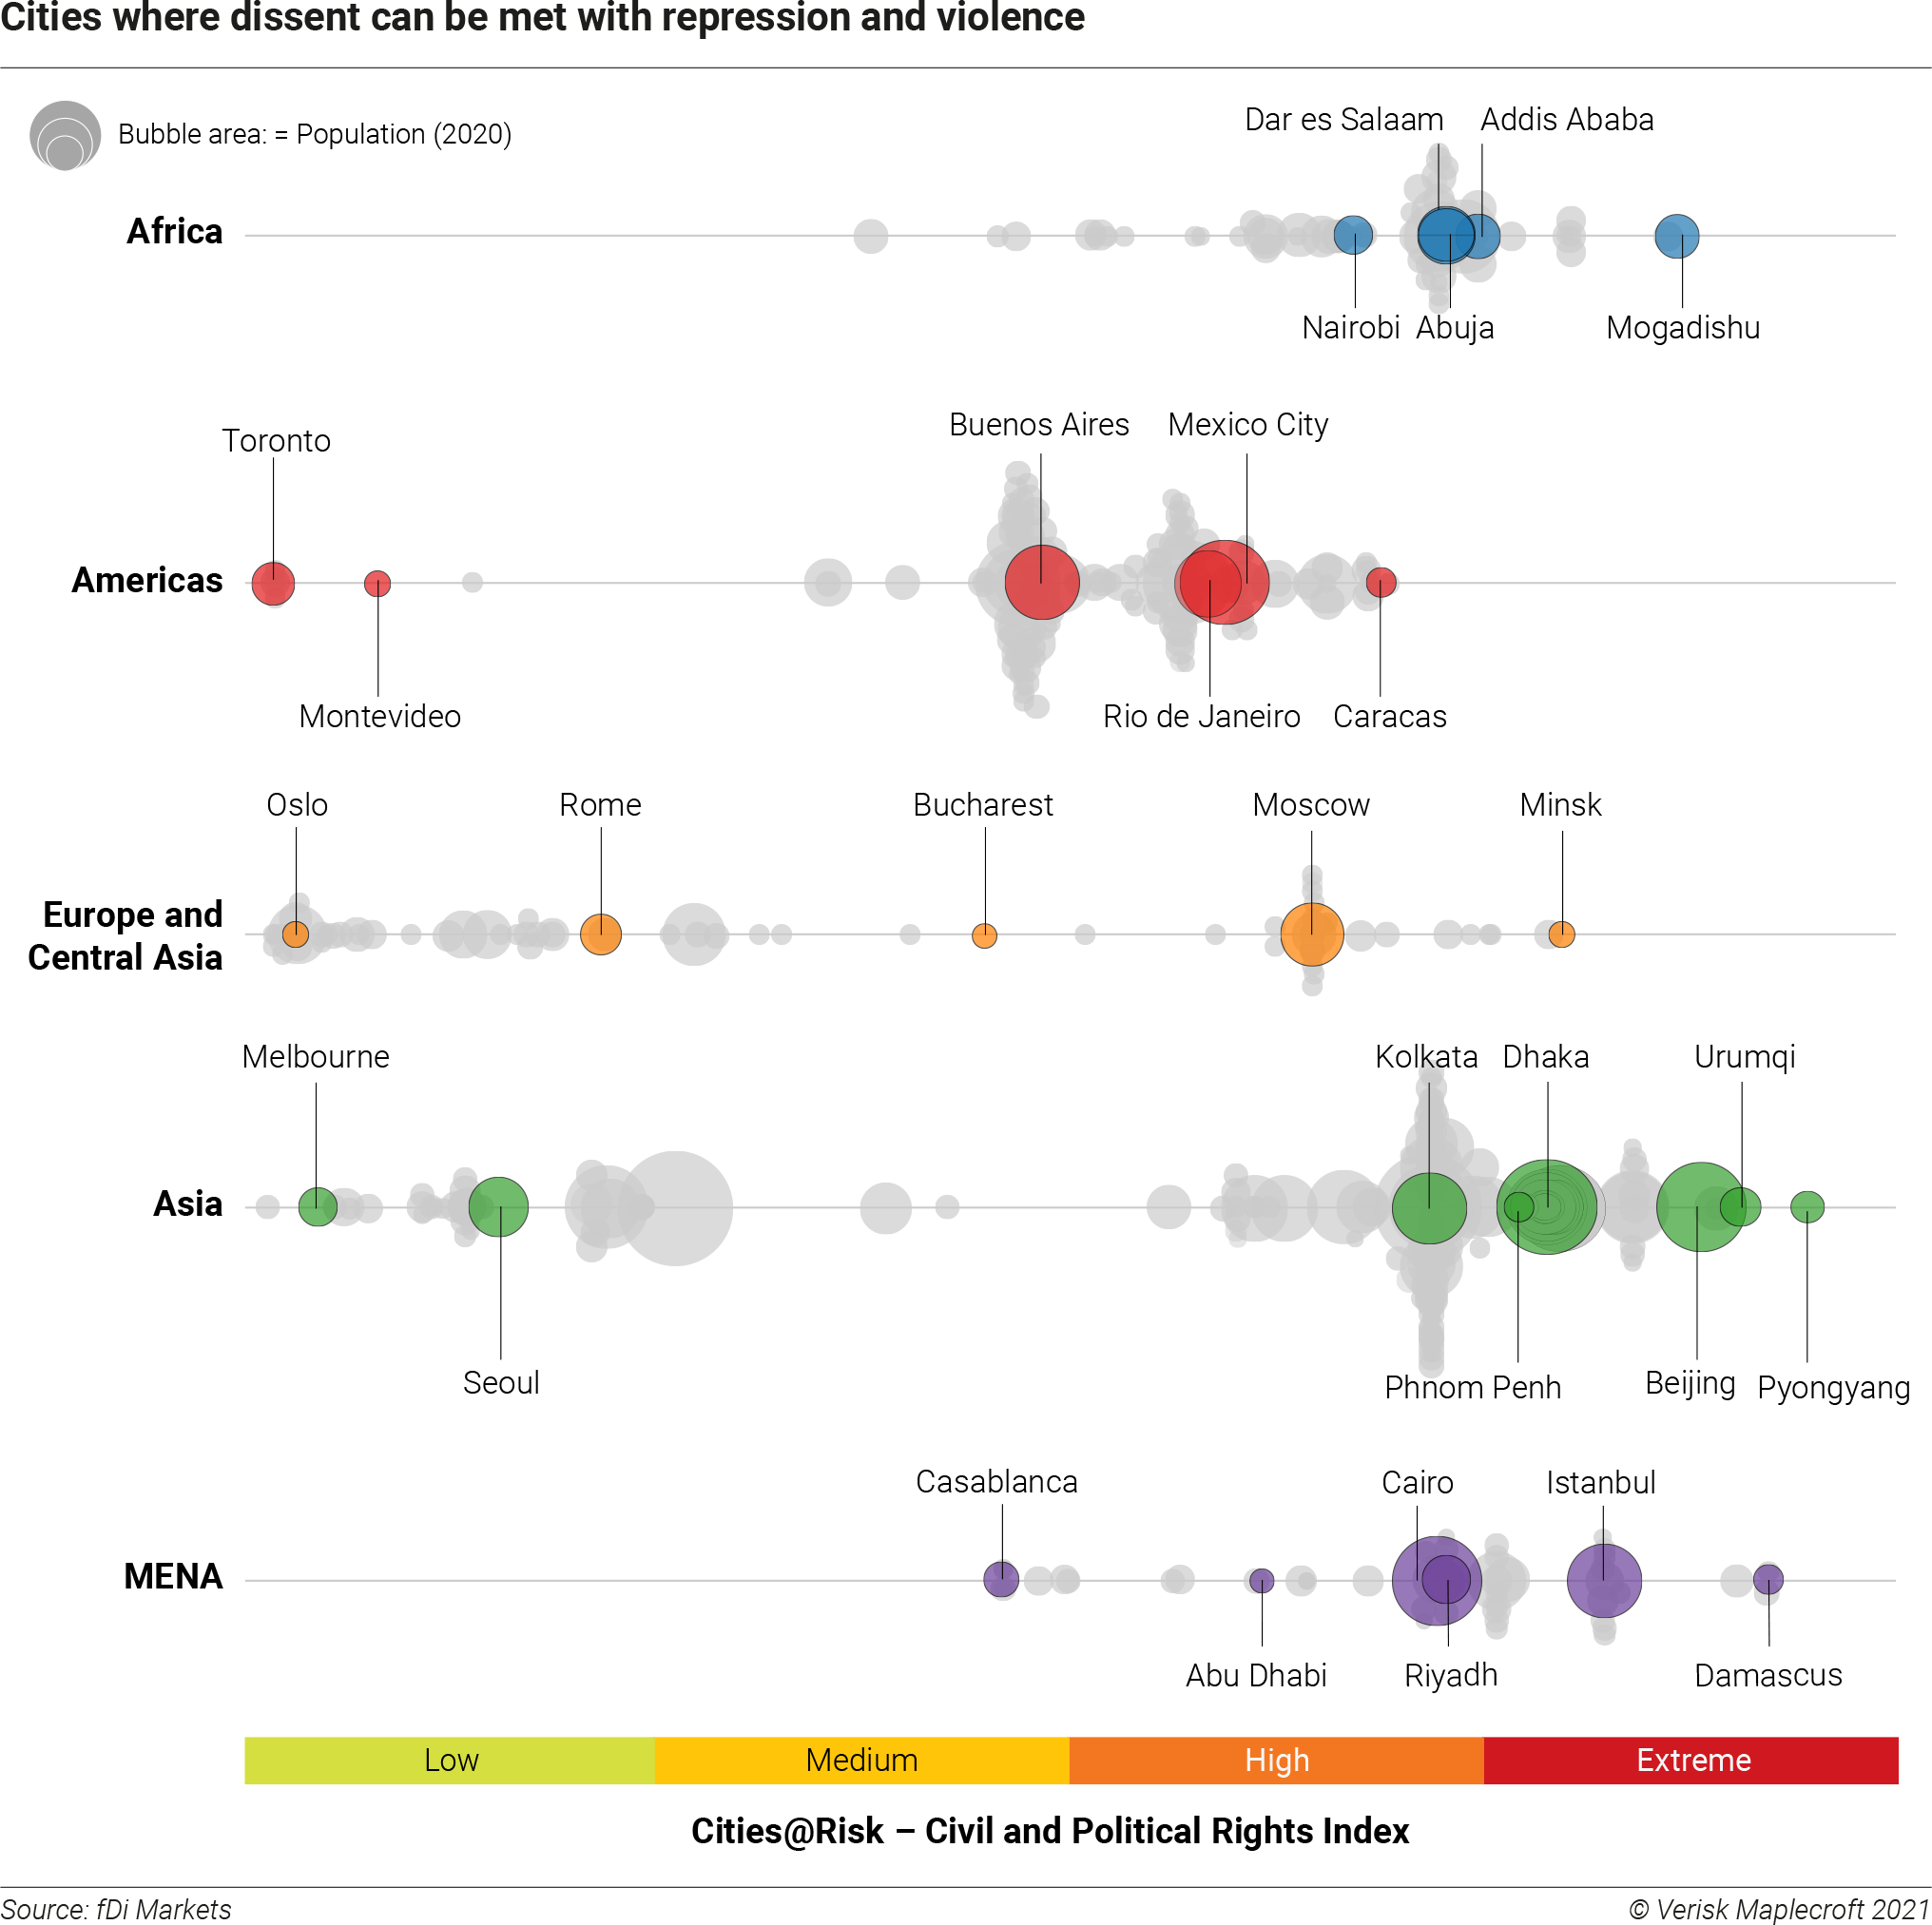
Civil and Political Risk Index
In addition to the overall ranking, the report provides insight into specific human rights violations, highlighting which cities are most at risk.
Perhaps unsurprisingly, Pyongyang, North Korea places first on the list when it comes to civil and political rights violations. Under the current North Korean regime, some significant civil rights violations include arbitrary arrests and detentions, the holding of political prisoners and detainees, and a lack of judicial independence. In addition to North Korea, Syria places high on the civil rights risk index as well, with three of the top five cities located in the war-torn country.
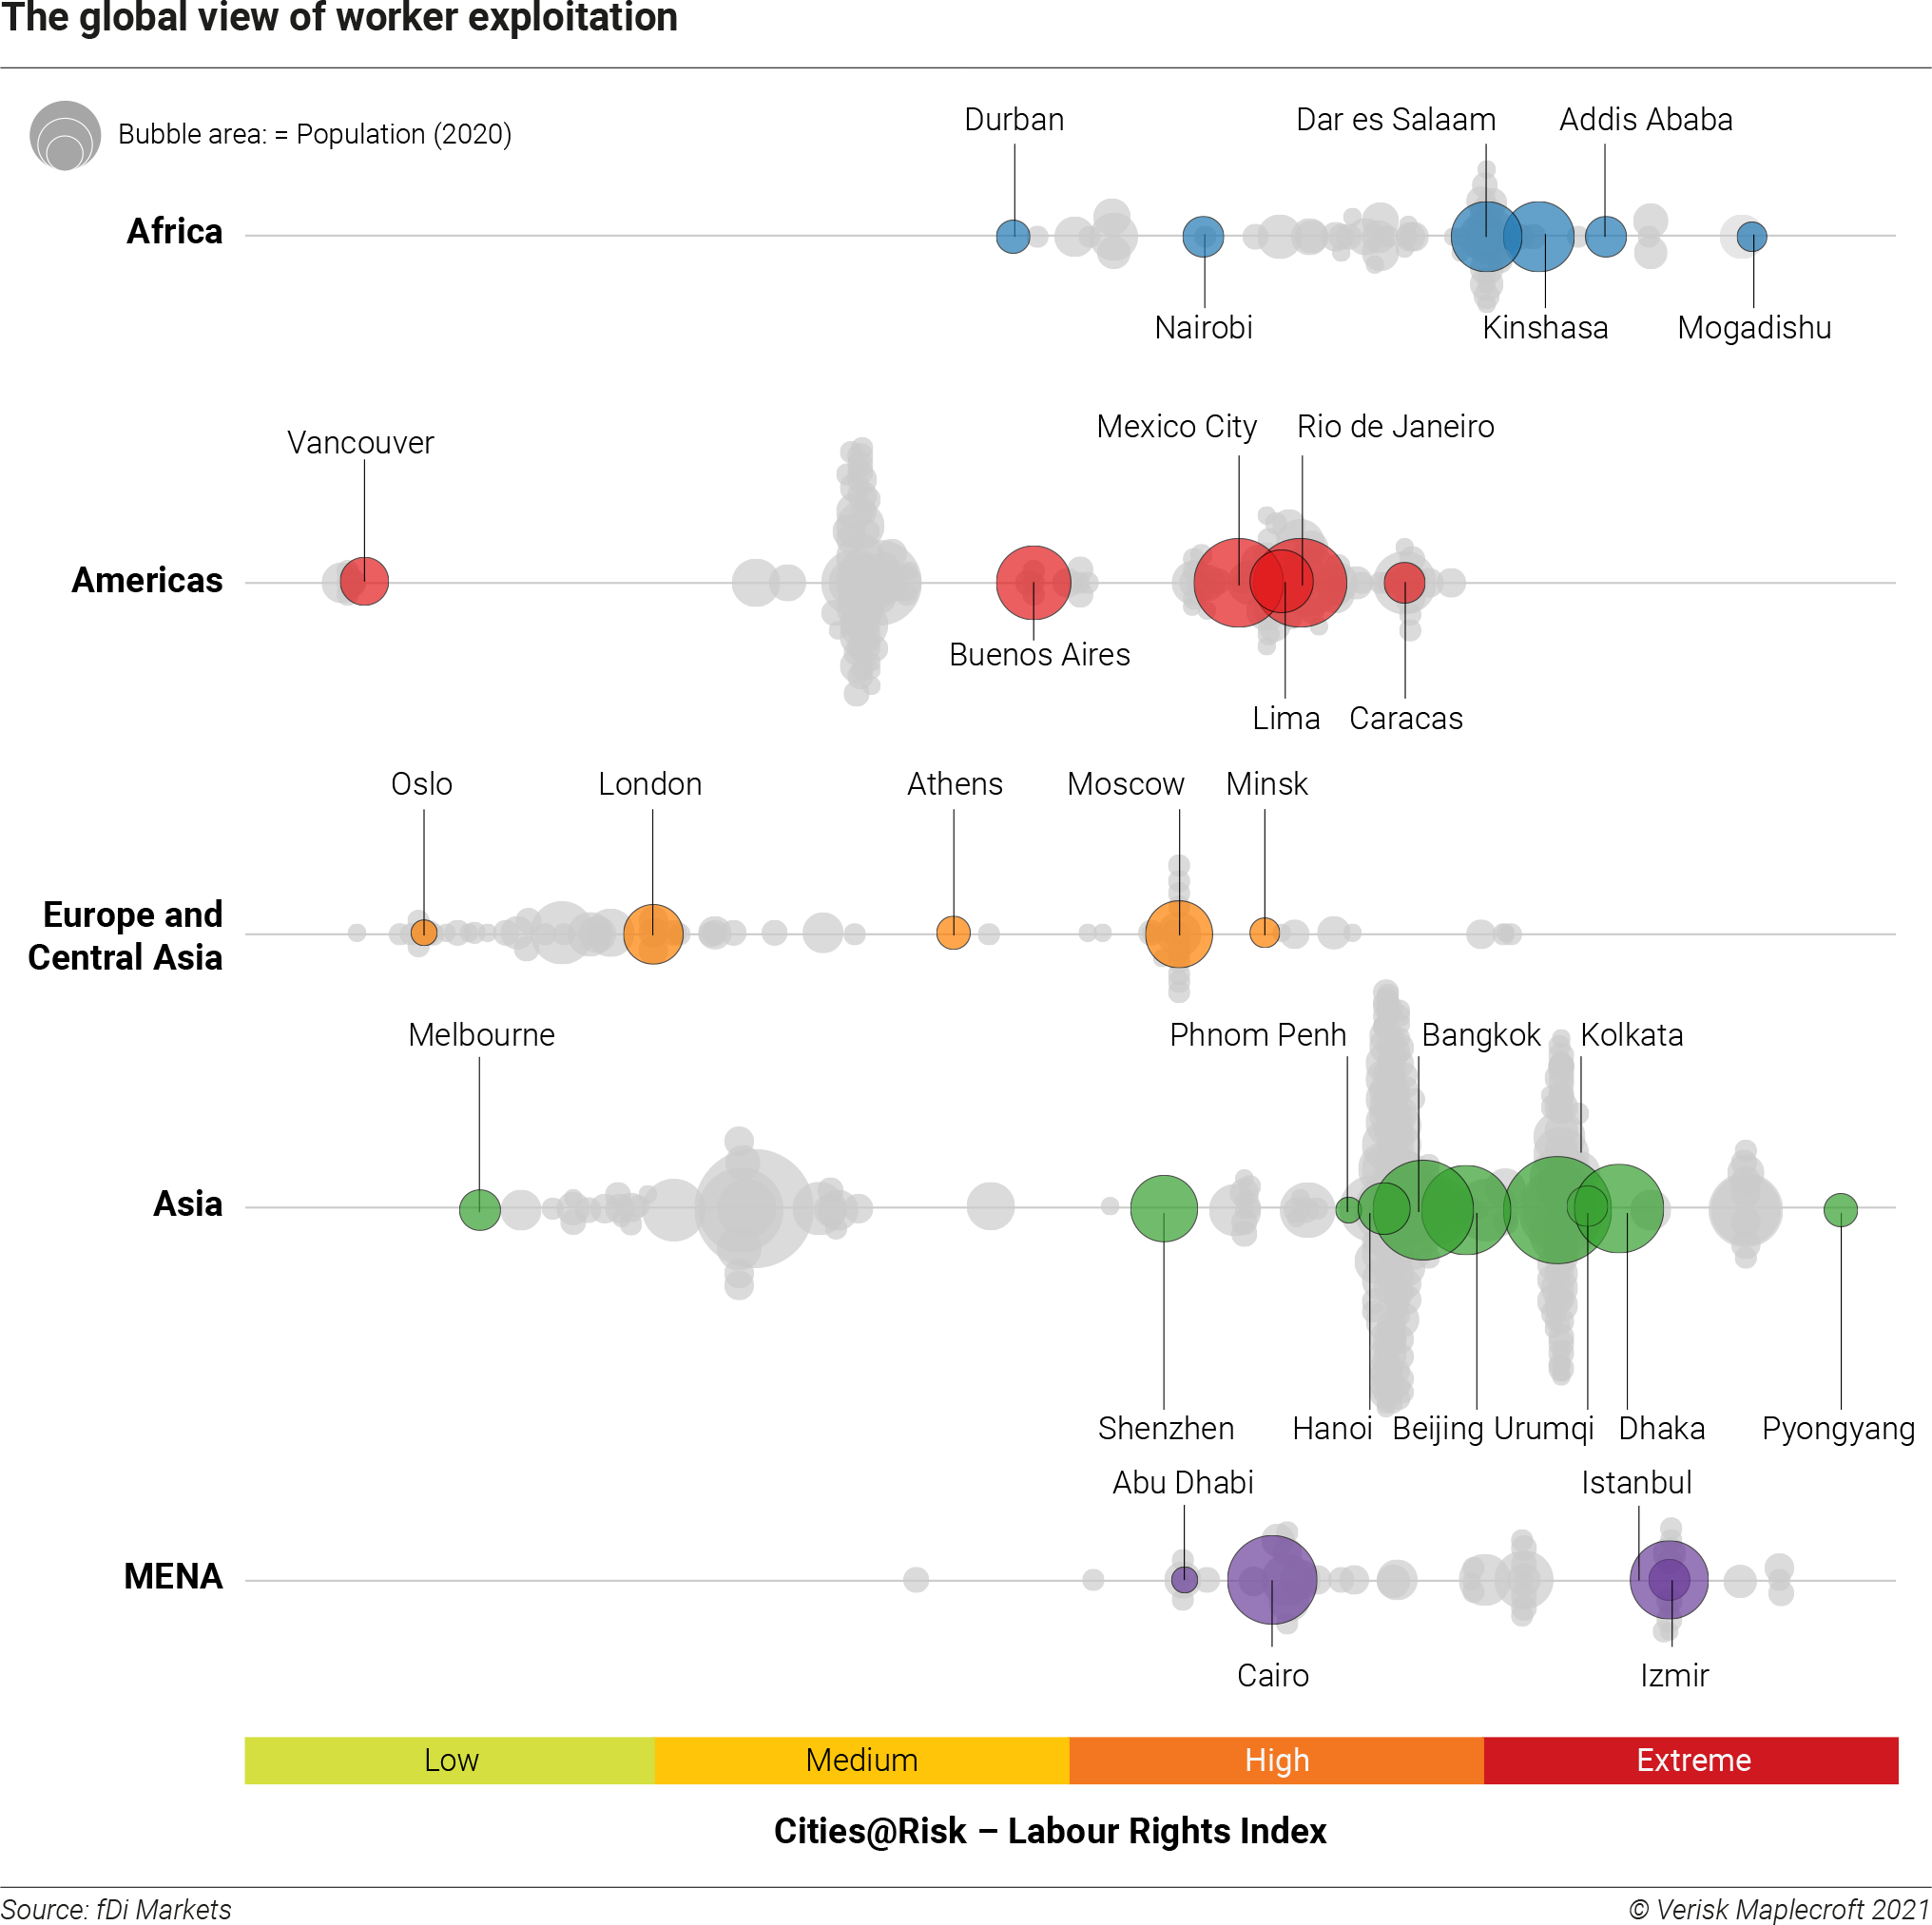
Labor Rights Index
When focusing specifically on labor rights, almost half of the ‘high’ or ‘extreme’ risk cities are in Europe and Central Asia.
The biggest problems across a majority of ‘high’ risk cities include child labor, the exploitation of migrant workers, and modern slavery. Pakistan in particular struggles with child labor issues, with an estimated 3.3 million children in situations of forced labor.
What This Means for Foreign Investors
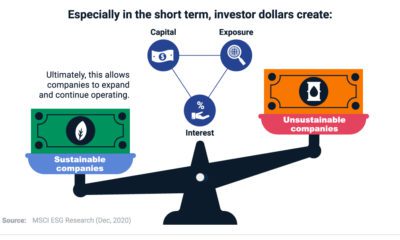
Understanding a country’s social landscape can help organizations make decisions on where to conduct business, especially those that prioritize ESG efforts. And, while organizations who invest in ‘high’ risk locations aren’t directly involved in any human rights violations, being associated with a ‘high’ risk city could impact a corporation’s reputation, or cause financial damage down the line. on Last year, stock and bond returns tumbled after the Federal Reserve hiked interest rates at the fastest speed in 40 years. It was the first time in decades that both asset classes posted negative annual investment returns in tandem. Over four decades, this has happened 2.4% of the time across any 12-month rolling period. To look at how various stock and bond asset allocations have performed over history—and their broader correlations—the above graphic charts their best, worst, and average returns, using data from Vanguard.
How Has Asset Allocation Impacted Returns?
Based on data between 1926 and 2019, the table below looks at the spectrum of market returns of different asset allocations:
We can see that a portfolio made entirely of stocks returned 10.3% on average, the highest across all asset allocations. Of course, this came with wider return variance, hitting an annual low of -43% and a high of 54%.
A traditional 60/40 portfolio—which has lost its luster in recent years as low interest rates have led to lower bond returns—saw an average historical return of 8.8%. As interest rates have climbed in recent years, this may widen its appeal once again as bond returns may rise.
Meanwhile, a 100% bond portfolio averaged 5.3% in annual returns over the period. Bonds typically serve as a hedge against portfolio losses thanks to their typically negative historical correlation to stocks.
A Closer Look at Historical Correlations
To understand how 2022 was an outlier in terms of asset correlations we can look at the graphic below:
The last time stocks and bonds moved together in a negative direction was in 1969. At the time, inflation was accelerating and the Fed was hiking interest rates to cool rising costs. In fact, historically, when inflation surges, stocks and bonds have often moved in similar directions. Underscoring this divergence is real interest rate volatility. When real interest rates are a driving force in the market, as we have seen in the last year, it hurts both stock and bond returns. This is because higher interest rates can reduce the future cash flows of these investments. Adding another layer is the level of risk appetite among investors. When the economic outlook is uncertain and interest rate volatility is high, investors are more likely to take risk off their portfolios and demand higher returns for taking on higher risk. This can push down equity and bond prices. On the other hand, if the economic outlook is positive, investors may be willing to take on more risk, in turn potentially boosting equity prices.
Current Investment Returns in Context
Today, financial markets are seeing sharp swings as the ripple effects of higher interest rates are sinking in. For investors, historical data provides insight on long-term asset allocation trends. Over the last century, cycles of high interest rates have come and gone. Both equity and bond investment returns have been resilient for investors who stay the course.