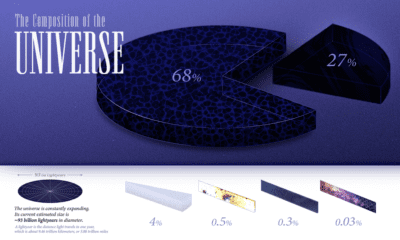
Elements in the Earth’s crust provide all the basic building blocks for mankind. But even though the crust is the source of everything we find, mine, refine, and build, it really is just scratching the surface of our planet. After all, the innermost layer of the Earth, the core, represents 15% of the planet’s volume, whereas the mantle occupies 84%. Representing the remaining 1% is the crust, a thin layer that ranges in depth from approximately 5-70 km (~3-44 miles). This infographic takes a look at what elements make up this 1%, based on data from WorldAtlas.
Earth’s Crust Elements
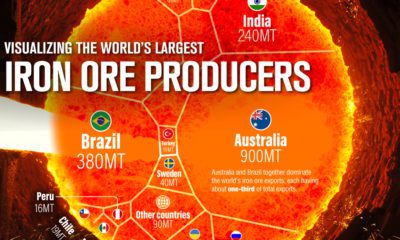
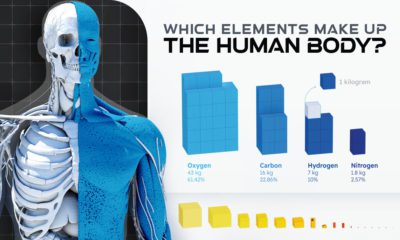
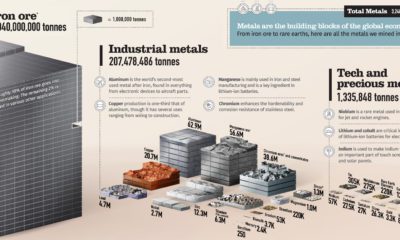
The crust is a rigid surface containing both the oceans and landmasses. Most elements are found in only trace amounts within the Earth’s crust, but several are abundant. The Earth’s crust comprises about 95% igneous and metamorphic rocks, 4% shale, 0.75% sandstone, and 0.25% limestone. Oxygen, silicon, aluminum, and iron account for 88.1% of the mass of the Earth’s crust, while another 90 elements make up the remaining 11.9%. While gold, silver, copper and other base and precious metals are among the most sought after elements, together they make up less than 0.03% of the Earth’s crust by mass.
#1: Oxygen
Oxygen is by far the most abundant element in the Earth’s crust, making up 46% of mass—coming up just short of half of the total. Oxygen is a highly reactive element that combines with other elements, forming oxides. Some examples of common oxides are minerals such as granite and quartz (oxides of silicon), rust (oxides of iron), and limestone (oxide of calcium and carbon).
#2: Silicon
More than 90% of the Earth’s crust is composed of silicate minerals, making silicon the second most abundant element in the Earth’s crust. Silicon links up with oxygen to form the most common minerals on Earth. For example, in most places, sand primarily consists of silica (silicon dioxide) usually in the form of quartz. Silicon is an essential semiconductor, used in manufacturing electronics and computer chips.
#3: Aluminum
Aluminum is the third most common element in the Earth’s crust. Because of its strong affinity for oxygen, aluminum is rarely found in its elemental state. Aluminum oxide (Al2O3), aluminum hydroxide (Al(OH)3) and potassium aluminum sulphate (KAl(SO4)2) are common aluminum compounds. Aluminum and aluminum alloys have a variety of uses, from kitchen foil to rocket manufacturing.
#4: Iron
The fourth most common element in the Earth’s crust is iron, accounting for over 5% of the mass of the Earth’s crust. Iron is obtained chiefly from the minerals hematite and magnetite. Of all the metals we mine, over 90% is iron, mainly to make steel, an alloy of carbon and iron. Iron is also an essential nutrient in the human body.
#5: Calcium
Calcium makes up about 4.2% of the planet’s crust by weight. In its pure elemental state, calcium is a soft, silvery-white alkaline earth metal. It is never found in its isolated state in nature but exists instead in compounds. Calcium compounds can be found in a variety of minerals, including limestone (calcium carbonate), gypsum (calcium sulphate) and fluorite (calcium fluoride). Calcium compounds are widely used in the food and pharmaceutical industries for supplementation. They are also used as bleaches in the paper industry, as components in cement and electrical insulators, and in manufacturing soaps.
Digging the Earth’s Crust
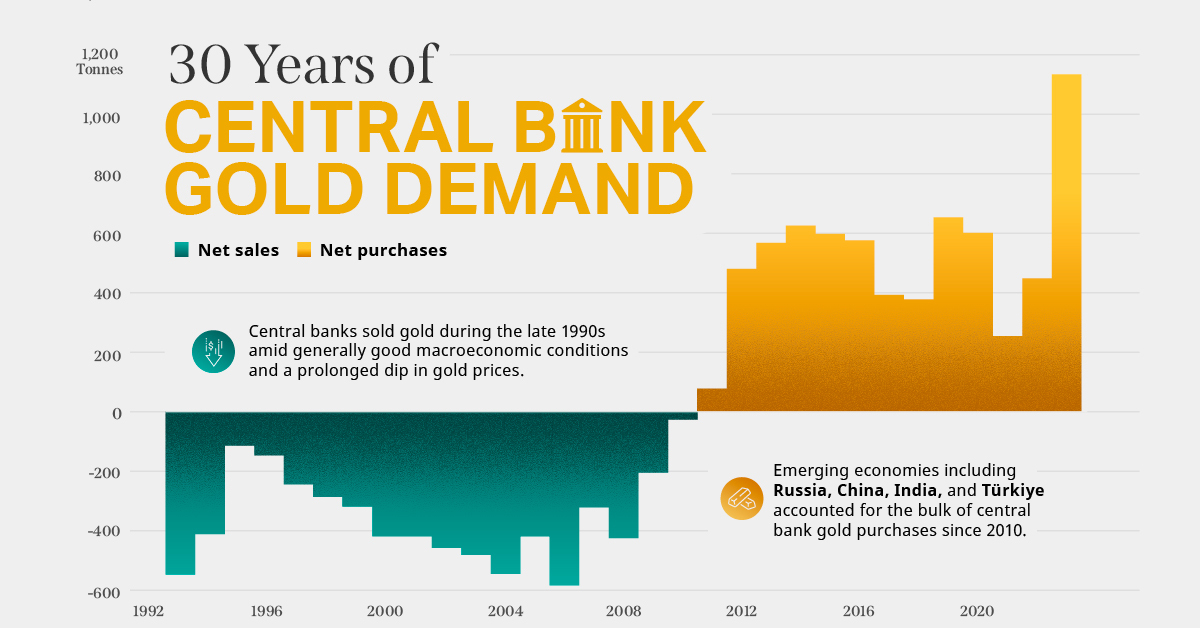
Despite Jules Verne’s novel, no one has ever journeyed to the center of Earth. In fact, the deepest hole ever dug by humanity reaches approximately 12 km (7.5 miles) below the Earth’s surface, about one-third of the way to the Earth’s mantle. This incredible depth took about 20 years to reach. Although mankind is constantly making new discoveries and reaching for the stars, there is still a lot to explore about the Earth we stand on. on Did you know that nearly one-fifth of all the gold ever mined is held by central banks? Besides investors and jewelry consumers, central banks are a major source of gold demand. In fact, in 2022, central banks snapped up gold at the fastest pace since 1967. However, the record gold purchases of 2022 are in stark contrast to the 1990s and early 2000s, when central banks were net sellers of gold. The above infographic uses data from the World Gold Council to show 30 years of central bank gold demand, highlighting how official attitudes toward gold have changed in the last 30 years.
Why Do Central Banks Buy Gold?
Gold plays an important role in the financial reserves of numerous nations. Here are three of the reasons why central banks hold gold:
Balancing foreign exchange reserves Central banks have long held gold as part of their reserves to manage risk from currency holdings and to promote stability during economic turmoil. Hedging against fiat currencies Gold offers a hedge against the eroding purchasing power of currencies (mainly the U.S. dollar) due to inflation. Diversifying portfolios Gold has an inverse correlation with the U.S. dollar. When the dollar falls in value, gold prices tend to rise, protecting central banks from volatility. The Switch from Selling to Buying In the 1990s and early 2000s, central banks were net sellers of gold. There were several reasons behind the selling, including good macroeconomic conditions and a downward trend in gold prices. Due to strong economic growth, gold’s safe-haven properties were less valuable, and low returns made it unattractive as an investment. Central bank attitudes toward gold started changing following the 1997 Asian financial crisis and then later, the 2007–08 financial crisis. Since 2010, central banks have been net buyers of gold on an annual basis. Here’s a look at the 10 largest official buyers of gold from the end of 1999 to end of 2021: Rank CountryAmount of Gold Bought (tonnes)% of All Buying #1🇷🇺 Russia 1,88828% #2🇨🇳 China 1,55223% #3🇹🇷 Türkiye 5418% #4🇮🇳 India 3956% #5🇰🇿 Kazakhstan 3455% #6🇺🇿 Uzbekistan 3115% #7🇸🇦 Saudi Arabia 1803% #8🇹🇭 Thailand 1682% #9🇵🇱 Poland1282% #10🇲🇽 Mexico 1152% Total5,62384% Source: IMF The top 10 official buyers of gold between end-1999 and end-2021 represent 84% of all the gold bought by central banks during this period. Russia and China—arguably the United States’ top geopolitical rivals—have been the largest gold buyers over the last two decades. Russia, in particular, accelerated its gold purchases after being hit by Western sanctions following its annexation of Crimea in 2014. Interestingly, the majority of nations on the above list are emerging economies. These countries have likely been stockpiling gold to hedge against financial and geopolitical risks affecting currencies, primarily the U.S. dollar. Meanwhile, European nations including Switzerland, France, Netherlands, and the UK were the largest sellers of gold between 1999 and 2021, under the Central Bank Gold Agreement (CBGA) framework. Which Central Banks Bought Gold in 2022? In 2022, central banks bought a record 1,136 tonnes of gold, worth around $70 billion. Country2022 Gold Purchases (tonnes)% of Total 🇹🇷 Türkiye14813% 🇨🇳 China 625% 🇪🇬 Egypt 474% 🇶🇦 Qatar333% 🇮🇶 Iraq 343% 🇮🇳 India 333% 🇦🇪 UAE 252% 🇰🇬 Kyrgyzstan 61% 🇹🇯 Tajikistan 40.4% 🇪🇨 Ecuador 30.3% 🌍 Unreported 74165% Total1,136100% Türkiye, experiencing 86% year-over-year inflation as of October 2022, was the largest buyer, adding 148 tonnes to its reserves. China continued its gold-buying spree with 62 tonnes added in the months of November and December, amid rising geopolitical tensions with the United States. Overall, emerging markets continued the trend that started in the 2000s, accounting for the bulk of gold purchases. Meanwhile, a significant two-thirds, or 741 tonnes of official gold purchases were unreported in 2022. According to analysts, unreported gold purchases are likely to have come from countries like China and Russia, who are looking to de-dollarize global trade to circumvent Western sanctions.
There were several reasons behind the selling, including good macroeconomic conditions and a downward trend in gold prices. Due to strong economic growth, gold’s safe-haven properties were less valuable, and low returns made it unattractive as an investment.
Central bank attitudes toward gold started changing following the 1997 Asian financial crisis and then later, the 2007–08 financial crisis. Since 2010, central banks have been net buyers of gold on an annual basis.
Here’s a look at the 10 largest official buyers of gold from the end of 1999 to end of 2021:
Source: IMF
The top 10 official buyers of gold between end-1999 and end-2021 represent 84% of all the gold bought by central banks during this period.
Russia and China—arguably the United States’ top geopolitical rivals—have been the largest gold buyers over the last two decades. Russia, in particular, accelerated its gold purchases after being hit by Western sanctions following its annexation of Crimea in 2014.
Interestingly, the majority of nations on the above list are emerging economies. These countries have likely been stockpiling gold to hedge against financial and geopolitical risks affecting currencies, primarily the U.S. dollar.
Meanwhile, European nations including Switzerland, France, Netherlands, and the UK were the largest sellers of gold between 1999 and 2021, under the Central Bank Gold Agreement (CBGA) framework.
Which Central Banks Bought Gold in 2022?
In 2022, central banks bought a record 1,136 tonnes of gold, worth around $70 billion. Türkiye, experiencing 86% year-over-year inflation as of October 2022, was the largest buyer, adding 148 tonnes to its reserves. China continued its gold-buying spree with 62 tonnes added in the months of November and December, amid rising geopolitical tensions with the United States. Overall, emerging markets continued the trend that started in the 2000s, accounting for the bulk of gold purchases. Meanwhile, a significant two-thirds, or 741 tonnes of official gold purchases were unreported in 2022. According to analysts, unreported gold purchases are likely to have come from countries like China and Russia, who are looking to de-dollarize global trade to circumvent Western sanctions.