Rental markets are heating up all over the continent, but there are specific cities that are feeling the brunt of this phenomenon. In places like San Francisco, Brooklyn, San Jose, Seattle, Vancouver, and Denver, city councils are starting to move into panic mode as regular citizens like teachers and nurses are voicing concerns about not being able to afford housing. Simultaneously, many communities are rightfully concerned about the “brain drain” of their young people, who are moving for greener pastures (i.e. where rent or property is affordable) to start their families.
Mapping Rent Prices
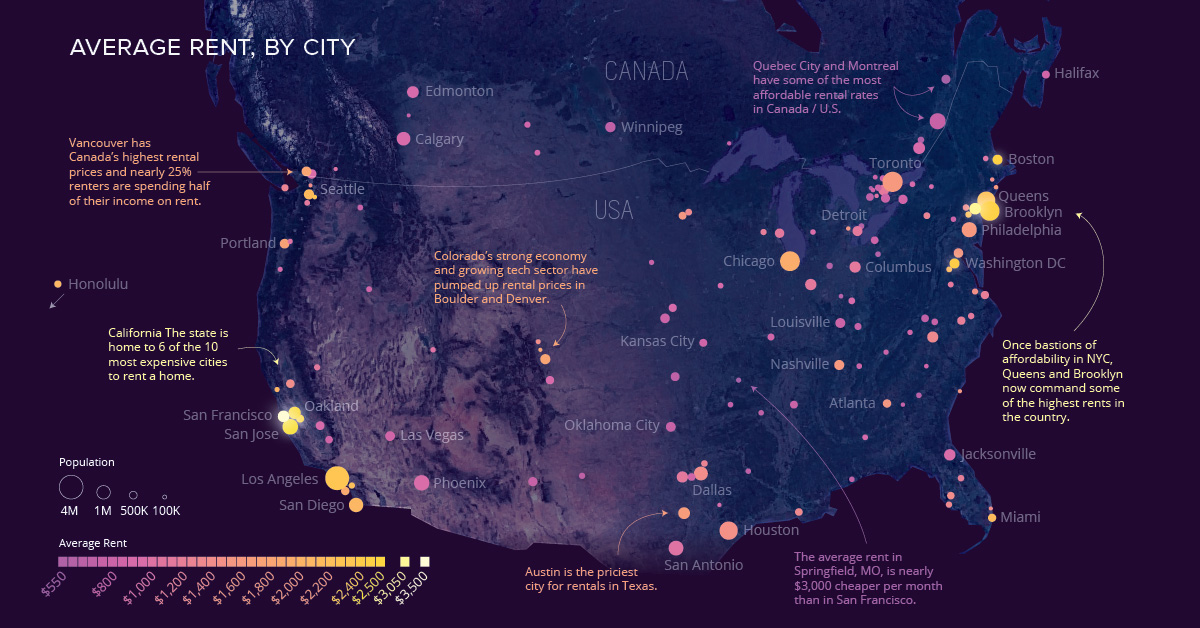
The situation of skyrocketing rents is a tricky one with no silver bullets. Given the circumstances, our contribution in today’s post is to provide some context and perspective on the situation. In the above chart, we mapped 148 cities in the U.S. and Canada and color-coded these cities based on average rent price. The size of each circle corresponds to city size as reported by U.S. Census and Statistics Canada data, and they represent the populations of the cities themselves – not the surrounding metro population. This means that Long Beach, CA is not lumped into Los Angeles, CA, for example. The chart was inspired by a compilation of data from WalletWyse, who used Numbeo estimates of the cost of living across these cities. Numbeo bases its rent estimates based on user-generated data for each city. As a final note, we omitted cities from the original list with fewer than 100,000 residents, and we kept NYC split up into boroughs.
Massive Disparity
Although rents are rising everywhere, some cities are seeing clear separation from the rest of the pack. There are 26 cities with rents higher than $1,500, and only two cities with rent over $3,000 (Manhattan and San Francisco). Meanwhile, there is a significant chunk (46%) of the cities on the list with average rents below $1,000, including several cities that have rent for as inexpensive as $500-$650 (Springfield, MO, Quebec City, QC, or Fort Wayne, IN). Did anything surprise you about the map and data? on The good news is that the Federal Reserve, U.S. Treasury, and Federal Deposit Insurance Corporation are taking action to restore confidence and take the appropriate measures to help provide stability in the market. With this in mind, the above infographic from New York Life Investments looks at the factors that impact bonds, how different types of bonds have historically performed across market environments, and the current bond market volatility in a broader context.
Bond Market Returns
Bonds had a historic year in 2022, posting one of the worst returns ever recorded. As interest rates rose at the fastest pace in 40 years, it pushed bond prices lower due to their inverse relationship. In a rare year, bonds dropped 13%.
Source: FactSet, 01/02/2023.
Bond prices are only one part of a bond’s total return—the other looks at the income a bond provides. As interest rates have increased in the last year, it has driven higher bond yields in 2023.
Source: YCharts, 3/20/2023.
With this recent performance in mind, let’s look at some other key factors that impact the bond market.
Factors Impacting Bond Markets
Interest rates play a central role in bond market dynamics. This is because they affect a bond’s price. When rates are rising, existing bonds with lower rates are less valuable and prices decline. When rates are dropping, existing bonds with higher rates are more valuable and their prices rise. In March, the Federal Reserve raised rates 25 basis points to fall within the 4.75%-5.00% range, a level not seen since September 2007. Here are projections for where the federal funds rate is headed in 2023:
Federal Reserve Projection*: 5.1% Economist Projections**: 5.3%
*Based on median estimates in the March summary of quarterly economic projections.**Projections based on March 10-15 Bloomberg economist survey. Together, interest rates and the macroenvironment can have a positive or negative effect on bonds.
Positive
Here are three variables that may affect bond prices in a positive direction:
Lower Inflation: Reduces likelihood of interest rate hikes. Lower Interest Rates: When rates are falling, bond prices are typically higher. Recession: Can prompt a cut in interest rates, boosting bond prices.
Negative
On the other hand, here are variables that may negatively impact bond prices:
Higher Inflation: Can increase the likelihood of the Federal Reserve to raise interest rates. Rising Interest Rates: Interest rate hikes lead bond prices to fall. Weaker Fundamentals: When a bond’s credit risk gets worse, its price can drop. Credit risk indicates the chance of a default, the risk of a bond issuer not making interest payments within a given time period.
Bonds have been impacted by these negative factors since inflation started rising in March 2021.
Fixed Income Opportunities
Below, we show the types of bonds that have had the best performance during rising rates and recessions.
Source: Derek Horstmeyer, George Mason University 12/3/2022. As we can see, U.S. ultrashort bonds performed the best during rising rates. Mortgage bonds outperformed during recessions, averaging 11.4% returns, but with higher volatility. U.S. long-term bonds had 7.7% average returns, the best across all market conditions. In fact, they were also a close second during recessions. When rates are rising, ultrashort bonds allow investors to capture higher rates when they mature, often with lower historical volatility.
A Closer Look at Bond Market Volatility
While bond market volatility has jumped this year, current dislocations may provide investment opportunities. Bond dislocations allow investors to buy at lower prices, factoring in that the fundamental quality of the bond remains strong. With this in mind, here are two areas of the bond market that may provide opportunities for investors:
Investment-Grade Corporate Bonds: Higher credit quality makes them potentially less vulnerable to increasing interest rates. Intermediate Bonds (2-10 Years): Allow investors to lock in higher rates.
Both types of bonds focus on quality and capturing higher yields when faced with challenging market conditions.
Finding the Upside
Much of the volatility seen in the banking sector was due to banks buying bonds during the pandemic—or even earlier—at a time when interest rates were historically low. Since then, rates have climbed considerably. Should rates moderate or stop increasing, this may present better market conditions for bonds. In this way, today’s steep discount in bond markets may present an attractive opportunity for price appreciation. At the same time, investors can potentially lock in strong yields as inflation may subside in the coming years ahead. Learn more about bond investing strategies with New York Life Investments.