As the global travel and tourism industry stalls, the spillover effects to global employment are wide-reaching. A total of 330 million jobs are supported by this industry around the world, and it contributes 10%, or $8.9 trillion to global GDP each year. Today’s infographic uses data from the World Travel & Tourism Council, and it highlights the countries that depend the most on the travel and tourism industry according to employment—quantifying the scale that the industry contributes to the health of the global economy.
Ground Control
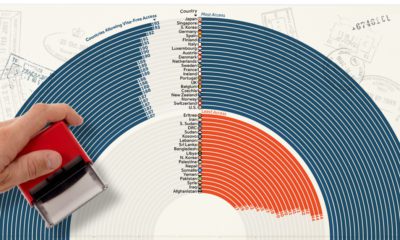
Worldwide, 44 countries rely on the travel and tourism industry for more than 15% of their total share of employment. Unsurprisingly, many of the countries suffering the most economic damage are island nations. At the same time, data reveals the extent to which certain larger nations rely on tourism. In New Zealand, for example, 479,000 jobs are generated by the travel and tourism industry, while in Cambodia tourism contributes to 2.4 million jobs. Croatia, another tourist hotspot, is hoping to reopen in time for peak season—the country generated tourism revenues of $13B in 2019. With a population of over 4 million, travel and tourism contributes to 25% of its workforce.
How the 20 Largest Economies Stack Up
Tourist-centric countries remain the hardest hit from global travel bans, but the world’s biggest economies are also feeling the impact.
In Spain, tourism ranks as the third highest contributor to its economy. If lockdowns remain in place until September, it is projected to lose $68 billion (€62 billion) in revenues.
On the other hand, South Korea is impacted the least: just 2.8% of its GDP is reliant on tourism.
Travel, Interrupted
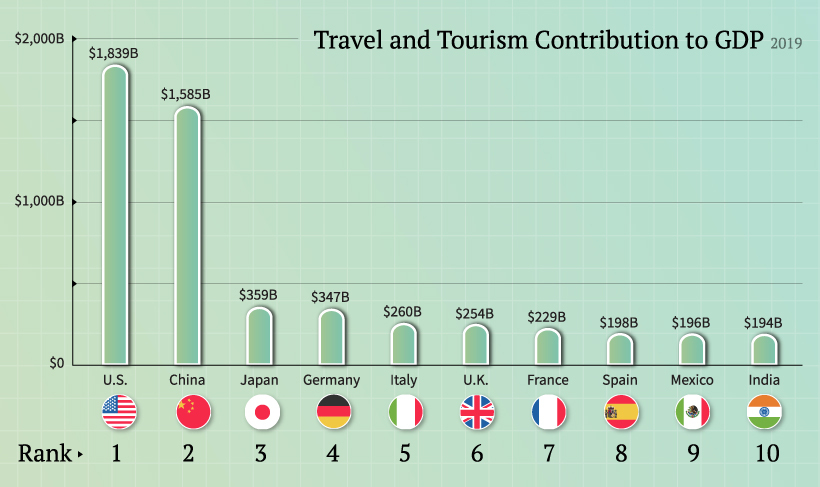
Which countries earn the most from the travel and tourism industry in absolute dollar terms? Topping the list was the U.S., with tourism contributing over $1.8 trillion to its economy, or 8.6% of its GDP in 2019. The U.S. remains a global epicenter for COVID-19 cases, and details remain unconfirmed if the country will reopen to visitors before summer.
Meanwhile, the contribution of travel and tourism to China’s economy has more than doubled over the last decade, approaching $1.6 trillion. To help bolster economic activity, China and South Korea have eased restrictions by establishing a travel corridor. As countries slowly reopen, other travel bubbles are beginning to make headway. For example, Estonia, Latvia, and Lithuania have eased travel restrictions by creating an established travel zone. Australia and New Zealand have a similar arrangement on the horizon. These travel bubbles allow citizens from each country to travel within a given zone. Of course, COVID-19 will have a lasting impact on employment and global economic activity with inconceivable outcomes. When the dust finally settles, could global tourism face a reckoning? on Last year, stock and bond returns tumbled after the Federal Reserve hiked interest rates at the fastest speed in 40 years. It was the first time in decades that both asset classes posted negative annual investment returns in tandem. Over four decades, this has happened 2.4% of the time across any 12-month rolling period. To look at how various stock and bond asset allocations have performed over history—and their broader correlations—the above graphic charts their best, worst, and average returns, using data from Vanguard.
How Has Asset Allocation Impacted Returns?
Based on data between 1926 and 2019, the table below looks at the spectrum of market returns of different asset allocations:
We can see that a portfolio made entirely of stocks returned 10.3% on average, the highest across all asset allocations. Of course, this came with wider return variance, hitting an annual low of -43% and a high of 54%.
A traditional 60/40 portfolio—which has lost its luster in recent years as low interest rates have led to lower bond returns—saw an average historical return of 8.8%. As interest rates have climbed in recent years, this may widen its appeal once again as bond returns may rise.
Meanwhile, a 100% bond portfolio averaged 5.3% in annual returns over the period. Bonds typically serve as a hedge against portfolio losses thanks to their typically negative historical correlation to stocks.
A Closer Look at Historical Correlations
To understand how 2022 was an outlier in terms of asset correlations we can look at the graphic below:
The last time stocks and bonds moved together in a negative direction was in 1969. At the time, inflation was accelerating and the Fed was hiking interest rates to cool rising costs. In fact, historically, when inflation surges, stocks and bonds have often moved in similar directions. Underscoring this divergence is real interest rate volatility. When real interest rates are a driving force in the market, as we have seen in the last year, it hurts both stock and bond returns. This is because higher interest rates can reduce the future cash flows of these investments. Adding another layer is the level of risk appetite among investors. When the economic outlook is uncertain and interest rate volatility is high, investors are more likely to take risk off their portfolios and demand higher returns for taking on higher risk. This can push down equity and bond prices. On the other hand, if the economic outlook is positive, investors may be willing to take on more risk, in turn potentially boosting equity prices.
Current Investment Returns in Context
Today, financial markets are seeing sharp swings as the ripple effects of higher interest rates are sinking in. For investors, historical data provides insight on long-term asset allocation trends. Over the last century, cycles of high interest rates have come and gone. Both equity and bond investment returns have been resilient for investors who stay the course.