However, each consecutive generation is finding it harder to make this ascent. In this graphic, we illustrate the decline in upward mobility over five decades using data from Opportunity Insights.
Understanding The Chart
This graphic plots the probability that a 30-year-old American has to outearn their parents (vertical axis) depending on their parent’s income percentile (horizontal axis). The 1st percentile represents America’s lowest earners, while the 99th percentile the richest. As we move from left to right on the chart, the portion of people who outearn their parents takes a steep decline. This suggests that people born into upper class families are less likely to outearn their parents, regardless of generation. The key takeaway, though, is that the starting point of this downward trend has shifted to the left. In other words, fewer people in the lower- and middle-classes are climbing the economic ladder. Declines can be seen across the board, but those growing up in the middle-class (50th percentile) have taken the largest hit. Within this bracket, individuals born in 1980 have only a 45% chance of outearning their parents at age 30, compared to 93% for those born in 1940.
Stagnating Wage Growth a Culprit
One factor behind America’s deteriorating upward mobility is the sluggish pace at which wages have grown. For example, the average hourly wage in 1964, when converted to 2018 dollars, is $20.27. Compare this to $22.65, the average hourly wage in 2018. That represents a mere 11.7% increase over a span of 54 years. However, this may not be as bad as it sounds. While the prices of some goods and services have risen over time, others have actually become more affordable. Since January 1998, for example, the prices of electronic goods such as TVs and cellphones have actually decreased. In this way, individuals today are more prosperous than previous generations. This benefit is likely outweighed by relative increases in other services, though. Whereas inflation since January 1998 totaled 58.8%, the costs of health and education services increased by more than 160% over the same time frame.
Income Distribution
While wages have been stagnant as a whole, it doesn’t paint the full picture. Another factor to consider is America’s changing income distribution. Source: Pew Research Center Like the data on upward mobility, the middle class takes the largest hit here, with its share of U.S. aggregate income falling by 19 percentage points. Over the same time frame, the upper class was able to increase its share of total income by 20 percentage points.
Is It All Bad News?
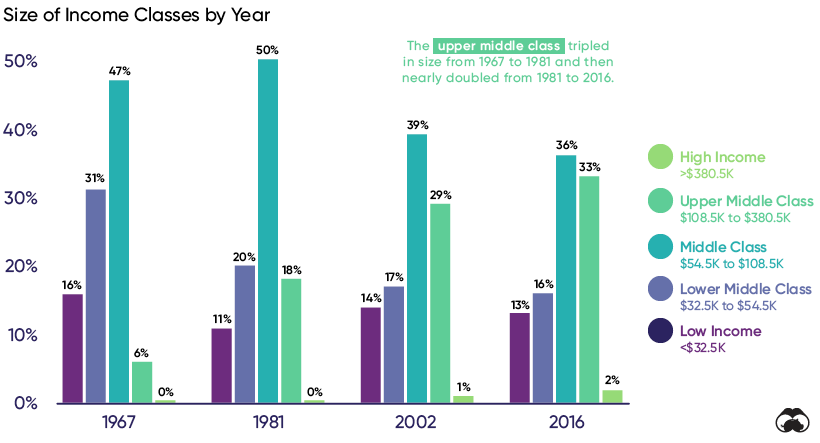
Americans are less likely to earn more than their parents, but this doesn’t mean that upward mobility has completely disappeared—it’s just becoming less accessible. Below, we illustrate the changes in size for different income classes from 1967 to 2016.
The upper middle class has grown significantly, from 6% of the population in 1967 to 33% in 2016. At the same time, the middle class shrank from 47% to 36% and the lower middle class shrank from 31% to 16%. The data suggests that some middle class Americans are still managing to pull themselves up into the next income bracket—it’s just not an effect that was as broad-based as it’s been in the past.
Does The American Dream Still Exist?
The American Dream is the belief that upward mobility is attainable for everyone through their own actions. This implies that growth will be continuous and widespread, two factors that have seemingly deteriorated in recent decades. Researchers believe there are numerous complex reasons behind America’s stagnating wages. A decline in union membership, for example, could be eroding employees’ collective bargaining power. Other factors such as technological change may also apply downwards pressure on the wages of less educated workers. Income inequality, on the other hand, is clearly shown by the data. We can also refer to the Gini-coefficient, a statistical measure of economic inequality. It ranges between 0 and 1, with 0 representing perfect equality and 1 representing perfect inequality (one person holds all the income). The U.S. currently has a Gini-coefficient of 0.434, the highest of any G7 country. Long story short, the American Dream is still alive—it’s just becoming harder to come by. on Both figures surpassed analyst expectations by a wide margin, and in January, the unemployment rate hit a 53-year low of 3.4%. With the recent release of February’s numbers, unemployment is now reported at a slightly higher 3.6%. A low unemployment rate is a classic sign of a strong economy. However, as this visualization shows, unemployment often reaches a cyclical low point right before a recession materializes.
Reasons for the Trend
In an interview regarding the January jobs data, U.S. Treasury Secretary Janet Yellen made a bold statement: While there’s nothing wrong with this assessment, the trend we’ve highlighted suggests that Yellen may need to backtrack in the near future. So why do recessions tend to begin after unemployment bottoms out?
The Economic Cycle
The economic cycle refers to the economy’s natural tendency to fluctuate between periods of growth and recession. This can be thought of similarly to the four seasons in a year. An economy expands (spring), reaches a peak (summer), begins to contract (fall), then hits a trough (winter). With this in mind, it’s reasonable to assume that a cyclical low in the unemployment rate (peak employment) is simply a sign that the economy has reached a high point.
Monetary Policy
During periods of low unemployment, employers may have a harder time finding workers. This forces them to offer higher wages, which can contribute to inflation. For context, consider the labor shortage that emerged following the COVID-19 pandemic. We can see that U.S. wage growth (represented by a three-month moving average) has climbed substantially, and has held above 6% since March 2022. The Federal Reserve, whose mandate is to ensure price stability, will take measures to prevent inflation from climbing too far. In practice, this involves raising interest rates, which makes borrowing more expensive and dampens economic activity. Companies are less likely to expand, reducing investment and cutting jobs. Consumers, on the other hand, reduce the amount of large purchases they make. Because of these reactions, some believe that aggressive rate hikes by the Fed can either cause a recession, or make them worse. This is supported by recent research, which found that since 1950, central banks have been unable to slow inflation without a recession occurring shortly after.
Politicians Clash With Economists
The Fed has raised interest rates at an unprecedented pace since March 2022 to combat high inflation. More recently, Fed Chairman Jerome Powell warned that interest rates could be raised even higher than originally expected if inflation continues above target. Senator Elizabeth Warren expressed concern that this would cost Americans their jobs, and ultimately, cause a recession. Powell remains committed to bringing down inflation, but with the recent failures of Silicon Valley Bank and Signature Bank, some analysts believe there could be a pause coming in interest rate hikes. Editor’s note: just after publication of this article, it was confirmed that U.S. interest rates were hiked by 25 basis points (bps) by the Federal Reserve.