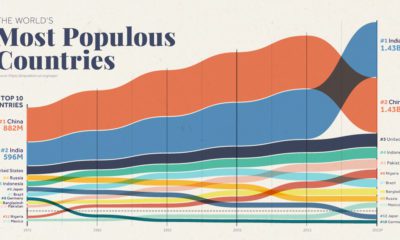
While this is consequential on a global economic level, it also leaves other population trends overlooked. For instance, Nigeria is projected to have more people than the U.S., the world’s third-largest country by population, by the year 2050. This treemap visualization, adapted from PopulationPyramid.net, is an overview of the global population in 2020, showing us the world’s most populous countries.
The 50 Most Populous Countries
China, with a population of 1.44 billion, is the most populous country worldwide. In 2019, over 60% of its population resided in urban centers, a trend that has seen the portion of city dwellers double over the last 25 years. For context, 83% of the U.S. population lives in cities, while just 35% of India’s population dwells in urban areas. Together, China and India’s populations make up over 36% of the global total. Extending over 17,000 islands, Indonesia comes fourth among the world’s most populous countries, standing at 273.5 million people. Pakistan comes in fifth, with 220.8 million. Karachi, located on the southeastern coast of Pakistan, is home to over 16 million people alone. It is Pakistan’s most populous city, and the seventh-largest city in the world. Nigeria also makes it onto the list. In just three decades, the country’s population is projected to climb from 206 million to 400 million—growing at a percentage clip that is more than double that of India.
The 50 Least Populous Countries
Combined, the 50 least-populous countries make up under 0.4% of the total world population. By contrast, the top 50 account for 87% of the total. Unsurprisingly, the world’s low population nations are situated on small islands, often tropical and reliant on tourism. *Source: United Nations, as of July 1, 2019. Includes territories. With a total of 799 residents in 2019, Vatican City is the least populated country. Following close behind is the territory of Tokelau, a cluster of islands situated between New Zealand and Hawaii. The Caribbean island nation of Antigua and Barbuda is also among the smallest populations in the world, with just 97,118 inhabitants. While it may be small in terms of total inhabitants, its population density is another story—with over 222 people per square kilometer. That is roughly 50% higher than China, but about half the population density of India. Meanwhile, the 33 pacific islands of Kiribati also make the top 50 list of the least populous countries worldwide. With a population of 117,606, Kiribati was a testing site for atomic bombs by the British and Americans during the 1960s. The island reached independence in 1979, after being under crown colonial rule since 1916.
Regional Median Ages
How about the median ages across these populations? By far, the African region has the lowest median age at 19.8 years old, partially driven by a high birth rate of 4.7 children per woman. In contrast, the global average falls around 2.5 children. By 2050, Africa’s population will effectively double from 1.3 billion to 2.5 billion. Source: Our World in Data On the other hand, Europe is the oldest, at 42.7 years for this demographic metric. With a median age of 47.9, Italy has the second-oldest population in the world, topped only by Japan. Meanwhile, Germany (46.6), Portugal (46.2), and Spain (45.5) fall next in line. If current trends continue, by 2050, half of Europe’s population will be non-working and over the age of 65. That said, it should be noted that this trend is not exclusive to Europe. In 30 years, 1.5 billion people globally will be over the age of 65, amounting to 16% of the global population. on Last year, stock and bond returns tumbled after the Federal Reserve hiked interest rates at the fastest speed in 40 years. It was the first time in decades that both asset classes posted negative annual investment returns in tandem. Over four decades, this has happened 2.4% of the time across any 12-month rolling period. To look at how various stock and bond asset allocations have performed over history—and their broader correlations—the above graphic charts their best, worst, and average returns, using data from Vanguard.
How Has Asset Allocation Impacted Returns?
Based on data between 1926 and 2019, the table below looks at the spectrum of market returns of different asset allocations:
We can see that a portfolio made entirely of stocks returned 10.3% on average, the highest across all asset allocations. Of course, this came with wider return variance, hitting an annual low of -43% and a high of 54%.
A traditional 60/40 portfolio—which has lost its luster in recent years as low interest rates have led to lower bond returns—saw an average historical return of 8.8%. As interest rates have climbed in recent years, this may widen its appeal once again as bond returns may rise.
Meanwhile, a 100% bond portfolio averaged 5.3% in annual returns over the period. Bonds typically serve as a hedge against portfolio losses thanks to their typically negative historical correlation to stocks.
A Closer Look at Historical Correlations
To understand how 2022 was an outlier in terms of asset correlations we can look at the graphic below:
The last time stocks and bonds moved together in a negative direction was in 1969. At the time, inflation was accelerating and the Fed was hiking interest rates to cool rising costs. In fact, historically, when inflation surges, stocks and bonds have often moved in similar directions. Underscoring this divergence is real interest rate volatility. When real interest rates are a driving force in the market, as we have seen in the last year, it hurts both stock and bond returns. This is because higher interest rates can reduce the future cash flows of these investments. Adding another layer is the level of risk appetite among investors. When the economic outlook is uncertain and interest rate volatility is high, investors are more likely to take risk off their portfolios and demand higher returns for taking on higher risk. This can push down equity and bond prices. On the other hand, if the economic outlook is positive, investors may be willing to take on more risk, in turn potentially boosting equity prices.
Current Investment Returns in Context
Today, financial markets are seeing sharp swings as the ripple effects of higher interest rates are sinking in. For investors, historical data provides insight on long-term asset allocation trends. Over the last century, cycles of high interest rates have come and gone. Both equity and bond investment returns have been resilient for investors who stay the course.