While this number can be useful in many different contexts, it can also be extremely limiting. The reality is that there’s a very wide range of incomes out there, even within a particular type of industry. Some people can barely make ends meet, and others make millions of dollars more. To view income distribution through a wider lens, data visualization expert Nathan Yau has created an interactive chart that breaks down millions of data points into just 50 dots per industry. The dots are visualized on a scale from $0 to $200k+ and binned in $5,000 increments. Data is also adjusted for inflation.
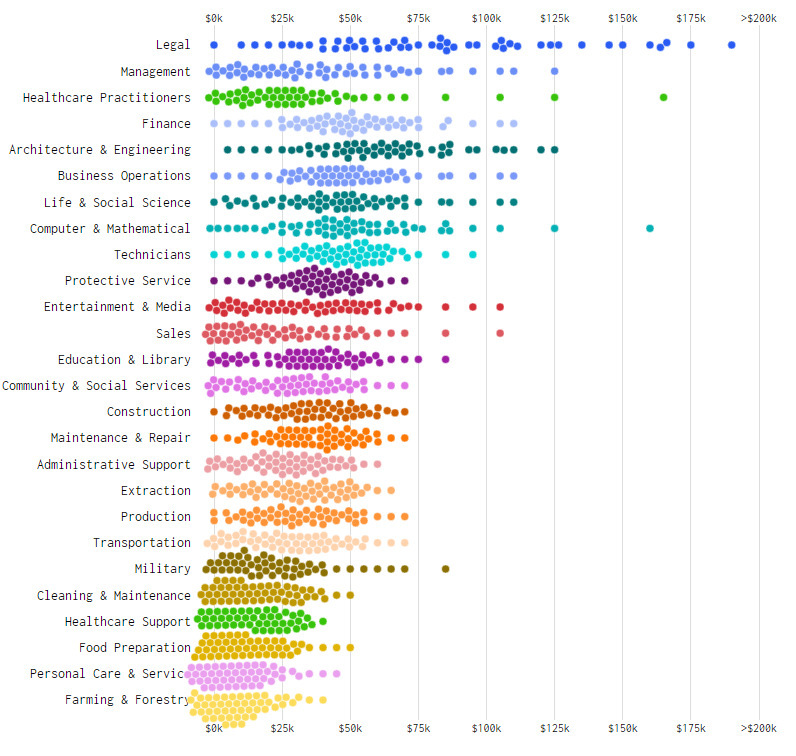
Income Distribution by Industry in 1960
Here’s a snapshot showing what income distribution looked like 57 years ago for a variety of broad industries:
Generally speaking, many of the ranges are on the lower side of things and tend to have data points clustered around the “middle” of each distribution.
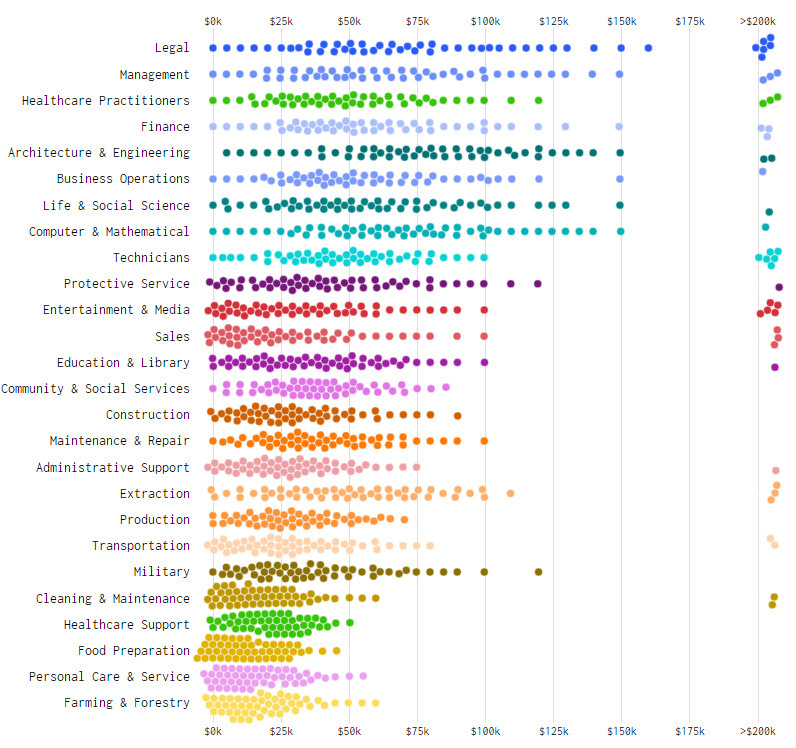
Income Distribution by Industry in 2014
Fast forward to 2014, and nearly every income bracket has expanded out. In many of these professions, workers are now making more money – this is good news for the economy. The downside? There are two problems: (1) Higher inequality, and (2) Many of the new jobs created recently are on the lower end of the income spectrum. As you can see, top earning lawyers, engineers, or managers are able to climb up towards the tops of their brackets. A lucky few are able to make $200k+, which is far more than the vast majority of the workforce. However, workers in other industries like food preparation or healthcare support are not so lucky. Unfortunately, in these sectors, making a middle-class income is very difficult – and many people are bringing in less than $25k per year. Yet, it is in these types of sectors that we’ve seen the majority of “new jobs” appear over recent years. It makes it difficult for society to solve the income inequality problem when this is the case.
on To see how the minimum wage differs around the world, we’ve visualized data from Picodi, which includes values for 67 countries as of January 2023.
Monthly Minimum Wage, by Country
The following table includes all of the data used in this infographic. Each value represents the monthly minimum wage a full-time worker would receive in each country. Picodi states that these figures are net of taxes and have been converted to USD. Generally speaking, developed countries have a higher cost of living, and thus require a higher minimum wage. Two outliers in this dataset are Argentina and Turkey, which have increased their minimum wages by 100% or more from January 2022 levels. Turkey is suffering from an ongoing currency crisis, with the lira losing over 40% of its value in 2021. Prices of basic goods have increased considerably as the Turkish lira continues to plummet. In fact, a 2022 survey found that 70% of people in Turkey were struggling to pay for food. Argentina, South America’s second-biggest economy, is also suffering from very high inflation. In response, the country announced three minimum wage increases throughout 2022.
Minimum Wage in the U.S.
Within the U.S., minimum wage varies significantly by state. We’ve visualized each state’s basic minimum rate (hourly) using January 2023 data from the U.S. Department of Labor.
2023-03-17 Update: This map was updated to fix several incorrect values. We apologize for any confusion this may have caused. America’s federal minimum wage has remained unchanged since 2009 at $7.25 per hour. Each state is allowed to set their own minimum wage, as long as it’s higher than the federal minimum. In states that do not set their own minimum, the federal minimum applies. If we assume someone works 40 hours a week, the federal minimum wage of $7.25 translates to an annual figure of just $15,080 before taxes. California’s minimum wage of $15.50 translates to $32,240 before taxes. For further perspective, check out our 2022 infographic on the salary needed to buy a home across 50 U.S. cities.