Wealthy countries consume massive amounts of natural resources per capita, and the United States is no exception. According to data from the National Mining Association, each American needs more than 39,000 pounds (17,700 kg) of minerals and fossil fuels annually to maintain their standard of living.
Materials We Need to Build
Every building around us and every sidewalk we walk on is made of sand, steel, and cement. As a result, these materials lead consumption per capita in the United States. On average, each person in America drives the demand of over 10,000 lbs of stone and around 7,000 lbs of sand and gravel per year. The construction industry is a major contributor to the U.S. economy. Crushed stone, sand, gravel, and other construction aggregates represent half of the industrial minerals produced in the country, resulting in $29 billion in revenue per year. Also on the list are crucial hard metals such as copper, aluminum, iron ore, and of course many rarer metals used in smaller quantities each year. These rarer metals can make a big economic difference even when their uses are more concentrated and isolated—for example, palladium (primarily used in catalytic converters) costs $54 million per tonne.
Fuels Powering our Lives
Despite ongoing efforts to fight climate change and reduce carbon emissions, each person in the U.S. uses over 19,000 lbs of fossil fuels per year.
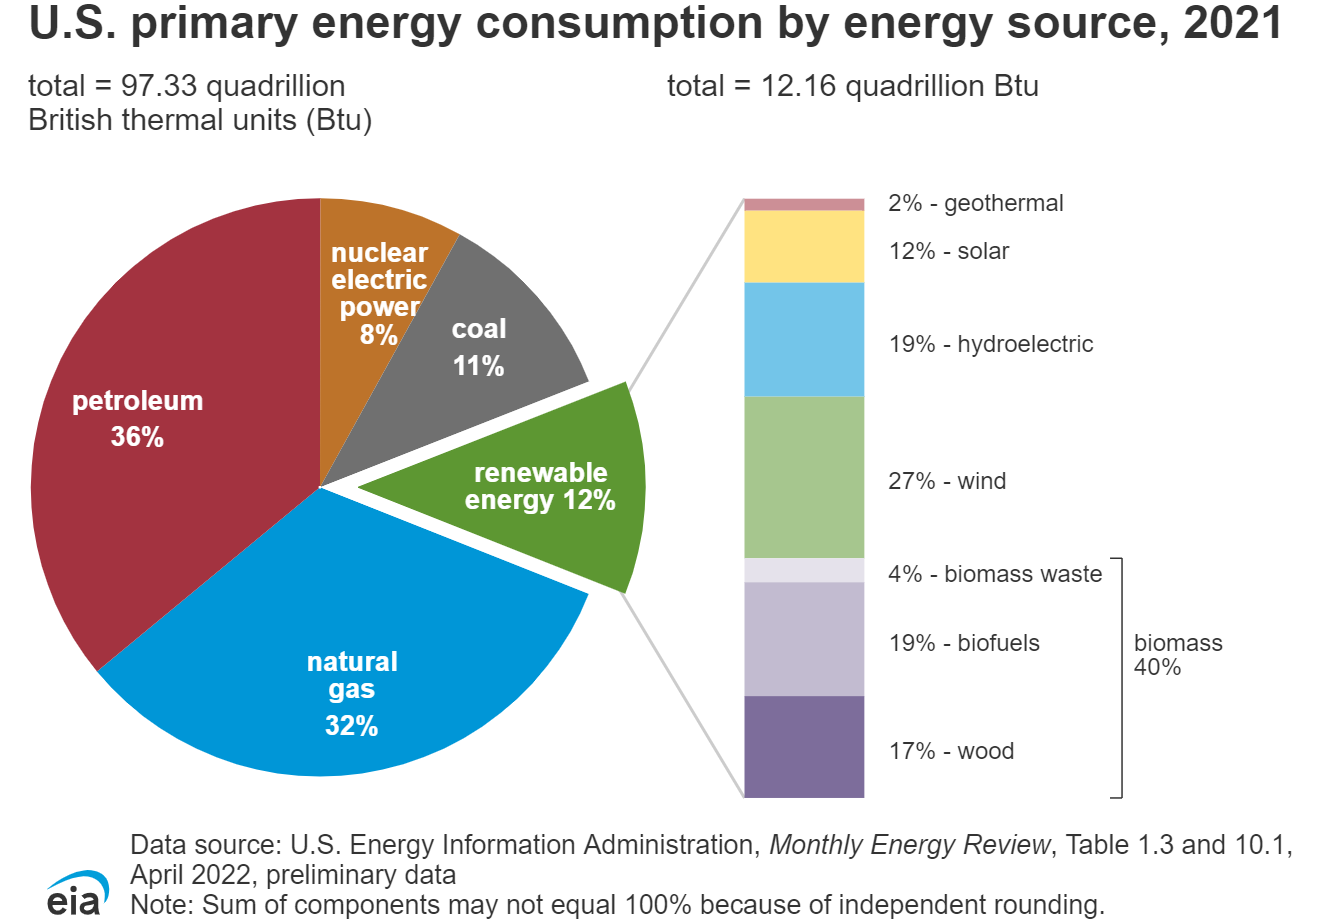
Gasoline is the most consumed petroleum product in the United States. In 2021, finished motor gasoline consumption averaged about 369 million gallons per day, equal to about 44% of total U.S. petroleum use. Distillate fuel oil (20%), hydrocarbon gas liquids (17%), and jet fuel (7%) were the next most important uses.
Reliance on Other Countries
Over the past three decades, the United States has become reliant on foreign sources to meet domestic demand for minerals and fossil fuels. Today, the country is 100% import-reliant for 17 mineral commodities and at least 50% for 30 others. In order to reduce the dependency on other countries, namely China, the Biden administration has been working to diversify supply chains in critical minerals. This includes strengthening alliances with other countries such as Australia, India, and Japan. However, questions still remain about how soon these policies can make an impact, and the degree to which they can ultimately help localize and diversify supply chains. on
#1: High Reliability
Nuclear power plants run 24/7 and are the most reliable source of sustainable energy. Nuclear electricity generation remains steady around the clock throughout the day, week, and year. Meanwhile, daily solar generation peaks in the afternoon when electricity demand is usually lower, and wind generation depends on wind speeds.As the use of variable solar and wind power increases globally, nuclear offers a stable and reliable backbone for a clean electricity grid.
#2: Clean Electricity
Nuclear reactors use fission to generate electricity without any greenhouse gas (GHG) emissions.Consequently, nuclear power is the cleanest energy source on a lifecycle basis, measured in CO2-equivalent emissions per gigawatt-hour (GWh) of electricity produced by a power plant over its lifetime. The lifecycle emissions from a typical nuclear power plant are 273 times lower than coal and 163 times lower than natural gas. Furthermore, nuclear is relatively less resource-intensive, allowing for lower supply chain emissions than wind and solar plants.
#3: Stable Affordability
Although nuclear plants can be expensive to build, they are cost-competitive in the long run. Most nuclear plants have an initial lifetime of around 40 years, after which they can continue operating with approved lifetime extensions. Nuclear plants with lifetime extensions are the cheapest sources of electricity in the United States, and 88 of the country’s 92 reactors have received approvals for 20-year extensions. Additionally, according to the World Nuclear Association, nuclear plants are relatively less susceptible to fuel price volatility than natural gas plants, allowing for stable costs of electricity generation.
#4: Energy Efficiency
Nuclear’s high energy return on investment (EROI) exemplifies its exceptional efficiency. EROI measures how many units of energy are returned for every unit invested in building and running a power plant, over its lifetime. According to a 2018 study by Weissbach et al., nuclear’s EROI is 75 units, making it the most efficient energy source by some distance, with hydropower ranking second at 35 units.
#5: Sustainable Innovation
New, advanced reactor designs are bypassing many of the difficulties faced by traditional nuclear plants, making nuclear power more accessible.
Small Modular Reactors (SMRs) are much smaller than conventional reactors and are modular—meaning that their components can be transported and assembled in different locations. Microreactors are smaller than SMRs and are designed to provide electricity in remote and small market areas. They can also serve as backup power sources during emergencies.
These reactor designs offer several advantages, including lower initial capital costs, portability, and increased scalability.
A Nuclear-Powered Future
Nuclear power is making a remarkable comeback as countries work to achieve climate goals and ultimately, a state of energy utopia. Besides the 423 reactors in operation worldwide, another 56 reactors are under construction, and at least 69 more are planned for construction. Some nations, like Japan, have also reversed their attitudes toward nuclear power, embracing it as a clean and reliable energy source for the future. CanAlaska is a leading exploration company in the Athabasca Basin, the Earth’s richest uranium depository. Click here to learn more now. In part 3 of the Road to Energy Utopia series, we explore the unique properties of uranium, the fuel that powers nuclear reactors.