Investors are bracing for longer inflation. The Federal Reserve indicated that more restrictive monetary policy is in the cards amid strong employment gains. In Europe, while inflation has fallen, it is still far above the 2% target. Across the Euro area inflation is estimated to have reached 8.5% in January. At the same time, some countries have managed to tamp down inflation. Slower growth, cheaper import costs, and foreign exchange policy are some of the factors keeping inflation subdued. As price pressures rattle global markets, the above infographic maps inflation rates globally using data from Trading Economics, focusing in on the countries with the lowest inflation levels.
World’s Lowest Inflation Rates
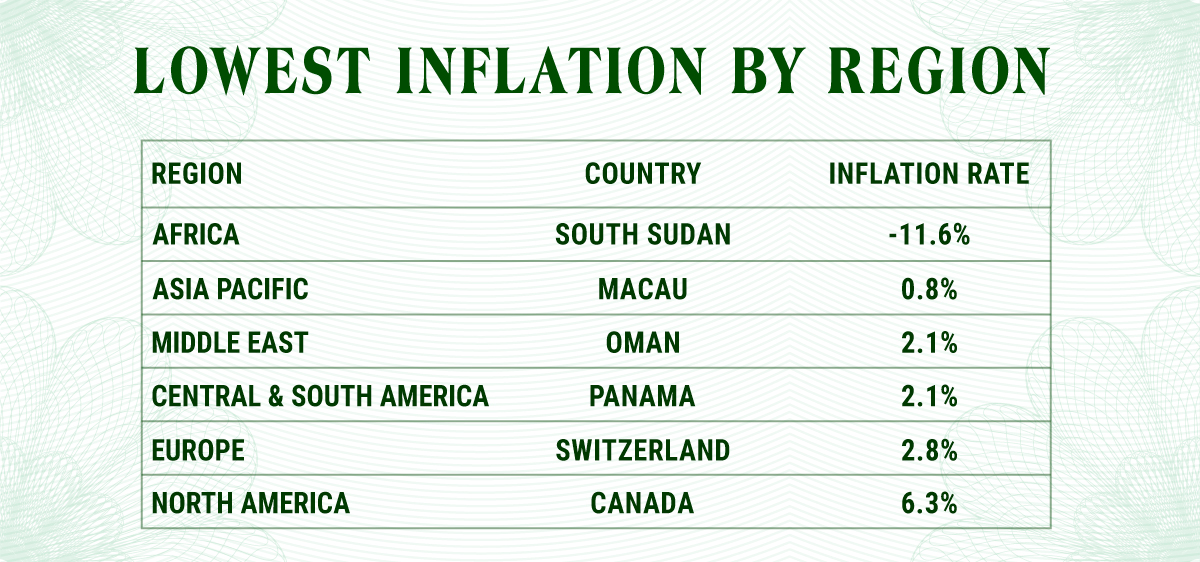
Many of the lowest inflation rates around the world are located in Asia, including Macau, China, Hong Kong, and Taiwan. In this region, widespread lockdowns strained growth and consumer spending, lessening inflationary pressures. Last year, Chinese consumers saved $2.2 trillion in bank deposits during these restrictions which were lifted earlier this year. Inflation in the region was impacted by several other factors. Earlier on in the pandemic, Asian countries including China were less impacted by rising food costs, services inflation, and supply-chain disruptions, unlike what was seen in North America and Europe. But now as China has reopened, some signs of inflation are beginning to appear. Food prices are up 4.8% annually in December, and hotel rates are rising. *Inflation rates based on latest available data. Globally, one outlier is South Sudan. Political instability and violence have depressed growth and inflation, which stood at -11.6% in December. As it faces a severe humanitarian crisis, the country has the lowest inflation rate worldwide. Oil-producing nation Oman has also seen low inflation, at 2.1%. One reason for this is that the Omani rial is pegged to the U.S. dollar, keeping the currency anchored. Inflation has remained moderate over the last decade in the country.
The Country With the Lowest Inflation, by Region
In Europe, Switzerland has the lowest inflation rate, at 2.8%, or roughly one-third of the Euro area’s. It is also the lowest rate in the OECD. The country’s strong currency has shielded it from inflationary pressures and high import prices. Meanwhile, Swiss production prices have risen marginally above inflation, to 4.1% annually in mid-2022. Last year, the Swiss central bank raised interest rates for the first time since 2007 from -0.75% to -0.25% following 20 years of deflation.
Panama has the lowest rate in Latin America. The dollarization of the Panamanian balboa has helped quash price pressures. In July, the government regulated the price of 72 items to keep the cost of living from rising after three weeks of protests as inflation climbed as high as 5.2% during the course of 2022. With the lowest inflation in Asia, Macau witnessed the tourism industry fall off a cliff given lockdown measures, and the economy saw both its GDP and inflation collapse in 2022. Its real GDP is projected to have fallen close to 30% for the year.
Future Gazing
The IMF estimates that 84% of countries around the world will have lower inflation than last year. By 2024, both headline and core inflation are projected to remain above pre-pandemic levels at 4.1%. Opposing forces of China’s reopening and weaker global growth could offset inflationary pressures, yet this interplay—among a host of other factors—remains to be seen. on Last year, stock and bond returns tumbled after the Federal Reserve hiked interest rates at the fastest speed in 40 years. It was the first time in decades that both asset classes posted negative annual investment returns in tandem. Over four decades, this has happened 2.4% of the time across any 12-month rolling period. To look at how various stock and bond asset allocations have performed over history—and their broader correlations—the above graphic charts their best, worst, and average returns, using data from Vanguard.
How Has Asset Allocation Impacted Returns?
Based on data between 1926 and 2019, the table below looks at the spectrum of market returns of different asset allocations:
We can see that a portfolio made entirely of stocks returned 10.3% on average, the highest across all asset allocations. Of course, this came with wider return variance, hitting an annual low of -43% and a high of 54%.
A traditional 60/40 portfolio—which has lost its luster in recent years as low interest rates have led to lower bond returns—saw an average historical return of 8.8%. As interest rates have climbed in recent years, this may widen its appeal once again as bond returns may rise.
Meanwhile, a 100% bond portfolio averaged 5.3% in annual returns over the period. Bonds typically serve as a hedge against portfolio losses thanks to their typically negative historical correlation to stocks.
A Closer Look at Historical Correlations
To understand how 2022 was an outlier in terms of asset correlations we can look at the graphic below:
The last time stocks and bonds moved together in a negative direction was in 1969. At the time, inflation was accelerating and the Fed was hiking interest rates to cool rising costs. In fact, historically, when inflation surges, stocks and bonds have often moved in similar directions. Underscoring this divergence is real interest rate volatility. When real interest rates are a driving force in the market, as we have seen in the last year, it hurts both stock and bond returns. This is because higher interest rates can reduce the future cash flows of these investments. Adding another layer is the level of risk appetite among investors. When the economic outlook is uncertain and interest rate volatility is high, investors are more likely to take risk off their portfolios and demand higher returns for taking on higher risk. This can push down equity and bond prices. On the other hand, if the economic outlook is positive, investors may be willing to take on more risk, in turn potentially boosting equity prices.
Current Investment Returns in Context
Today, financial markets are seeing sharp swings as the ripple effects of higher interest rates are sinking in. For investors, historical data provides insight on long-term asset allocation trends. Over the last century, cycles of high interest rates have come and gone. Both equity and bond investment returns have been resilient for investors who stay the course.